INTRODUCTION
Various adjuvant treatments, including chemotherapy, anti-hormonal treatment (HTx), and radiation therapy after surgery for patients with breast cancer have proven to be effective in preventing disease progression and improving the overall survival rate [1-3]. However, these treatments affect bone health in different ways depending on each patient’s clinical condition, such as age, menopausal status, and treatment regimen [4,5].
Previous studies have evaluated the effects of various HTxs on bone health in pre- and post-menopausal women. Tamoxifen (TMX), a selective estrogen receptor modulator, is associated with the preservation of bone mineral density (BMD) [6]. In contrast, aromatase inhibitors (AI), which block the synthesis of estrogens, have been shown to increase fracture risk [4,7,8]. Gonadotropin-releasing hormone analogs (GnRHa), which suppress ovarian function, have recently been combined with TMX and AI in patients with premenopausal breast cancer [2]. GnRHa itself has a strong negative impact on bone health, and the combination of TMX and GnRHa (TMX + GnRHa) shows a slightly lower decrease in BMD than the combination of AI and GnRHa (AI + GnRHa) [7,9].
However, owing to the complexity of therapies for individual patients with breast cancer, it is difficult to investigate the association between bone health and HTx. This study analyzed the effects of HTxs on bone health using real-world evidence. We reviewed the records of 244 patients with breast cancer who were treated at the Pusan National University Hospital, taking into account all the possible clinical factors that might affect bone health. We used the trabecular bone score (TBS), a recently developed bone quality parameter acquired using dual-energy absorptiometry (DXA), to measure bone health. TBS was developed to meet the need for a clinical tool capable of assessing bone microarchitecture. TBS is a textural parameter that evaluates pixel gray level changes in lumbar spine (LS) DXA images. TBS variations may reflect skeletal microarchitecture [10]. Machine-learning algorithms were applied to identify the pattern and the most affected clinical factors that we might miss due to multiple variables and complex associations on bone health.
Our study evaluated the associations between HTxs, various clinical conditions, and bone health in Korean women with breast cancer.
METHODS
Patients
This study retrospectively recruited patients who underwent breast cancer treatment between January 2014 and June 2018. Patients were eligible if they underwent baseline DXA before the operation and follow-up DXA to monitor their BMD. The study enrolled 244 women (age at first visit ≥ 20). This longitudinal, retrospective study was approved by our Institutional Review Board, which waived the requirement for written informed consent (IRB No. H-1801-003-062).
Clinical variables
We extracted 20 clinical variables, including demographic information, operation type, histopathological results, hormonal status of the tumor, treatment information, and medications related to vitamin D or calcium. The history and duration of HTx were also reviewed. No bone-modifying therapy was administered during follow-up. The variable information included multilevel categorical variables and numerical values. The collected data were curated manually.
DXA
To measure the BMD (g/cm2) of the LS, we used a DXA scanner (Lunar Prodigy; GE Medical Systems, Milwaukee, WI, USA) and the Encore software (ver. 13.0; GE Healthcare, Madison, WI, USA) for analysis. Baseline and first follow-up DXA images were used for analysis. Daily calibration and quality assurance tests were performed, and the coefficient of variation for the precise measurement of BMD of the LS was 0.34%. We did not categorize the BMD status of the patients as normal, osteopenic, or osteoporotic because the menopausal status of the enrolled patients varied, and the T-score was inappropriate for those patients. The average TBS of L1-4 was extracted from the DXA file using the iNsight software (ver. 3.0.2.0; Med-Imaps, Pessac, France). The least significant change (LSC) at the 95% confidence level was within 0.053 for TBS. The patients were divided into three groups according to the following TBS cutoffs proposed by an international working group of TBS users for post-menopausal women: normal for TBS values ≥ 1.35, degraded microarchitecture for values between 1.20 and 1.35, and highly degraded for values ≤ 1.20 [11,12].
Data preprocessing
All categorical variables were converted into numeric variables for the machine-learning analysis. A standard normalization method was used for each variable. Missing values were introduced into our dataset owing to the characteristics of the real-world data. Multivariate imputation using chained equations (MICE) was performed to impute missing values [13,14].
TBS was used to classify the patients into three groups according to the change in TBS values from before the operation to follow-up; (1) the patients whose TBS increased were defined as ‘improved’, (2) the patients whose TBS decreased after follow-up were allocated to the ‘deteriorated’ group, and (3) patients with no difference in TBS between baseline and follow-up were classified as ‘no change’.
Machine-learning analysis
To identify which of the 20 clinical variables were highly associated with patients’ BMD, we applied a feature ranking algorithm, a partial least squares discriminant analysis (PLS-DA), implemented in the mixOmics R package version 6.10.9 [15] and MetaboAnalyst [16]. The self-organizing map (SOM) clustering algorithm was used to group patients based on the selected variables [17]. A 3×4 grid panel was selected for the SOM output structure to identify clinically meaningful evidence. Patients were grouped into the same cluster if the clinical factor patterns were similar. The SOM algorithm implemented in the MATLAB 2018b software (http://www.mathworks.com) was used.
Statistical analysis
Values of all normally distributed variables were expressed as means±standard deviation or the median [min, max]. The independent sample t-test, Kruskal–Wallis test, and one-way ANOVA were used to compare continuous variables among the different groups. For comparing the categorical data of the groups, the X2 test was used. Statistical analyses were performed using the IBM SPSS Statistics 22 software (web version, IBM Corp., Armonk, NY, USA). Statistical significance was set at p< 0.05.
RESULTS
Baseline characteristics
In the basic analysis, 228 of the 244 patients, excluding 16 who were not identified for BMD follow-up, were the targets. Demographic information and baseline characteristics are shown in Table 1. All patients were followed-up for a median period of 13 months. The median age was significantly higher in the groups treated with AI (median 60.0) and TMX (median 47.0) than in the groups treated with TMX + GnRHa (median 40.0) or untreated (median 53.5). In patients included in the study, there were no cases of changes in anti-hormonal drugs during the follow-up period. The operation type, histological type, and grade were significantly different based on HTx. Serum levels of phosphate and alkaline phosphatasewere relatively lower in the TMX and TMX + GnRHa groups than in the untreated and AI groups. Baseline DXA values, including TBS, BMD, T-score, and BMD status were significantly different among the different hormonal treatments. Osteopenia and osteoporosis were more common in the untreated and AI groups, whereas most patients in the TMX and TMX + GnRHa groups had a normal BMD.
Difference in baseline variables according to TBS changes
The patients were classified as ‘no change’ (n =161, 70.6%), ‘deteriorated’ (n = 43, 18.9%), or ‘improved’ (n =24, 10.5%) according to the change of TBS between baseline and the follow-up period. In the improved group, none of the patients were treated with TMX + GnRHa. The mean change in TBS, age, stage, presence of calcium/vitamin D supplementation, chemotherapy, and radiotherapy were not significantly different among the groups. The baseline TBS value was significantly lower in the improved group. The differences in body mass index (BMI) were not significant (Table 2).
Machine-learning analysis workflow and data preparation
We identified key clinical variables affecting TBS changes in patients with breast cancer and to identify patterns across the variables to increase the understanding of patients’ clinical status during HTx. Machine-learning algorithms were used to select key variables and identify patterns of interest. The missing data of 16 patients without BMD follow-up were automatically entered using the algorithm. Clinical data were curated by experts and missing values were imputed using the MICE tool. Categorical data were converted into numeric data, and standard normalization was applied to each variable to apply the machine-learning algorithms. Next, the PLS-DA classification algorithm was used to rank the clinical variables highly associated with TBS changes. The selected variables were used as SOM input to discover the patterns of the selected variables to investigate the patients’ clinical status.
Variable selection using classification algorithm
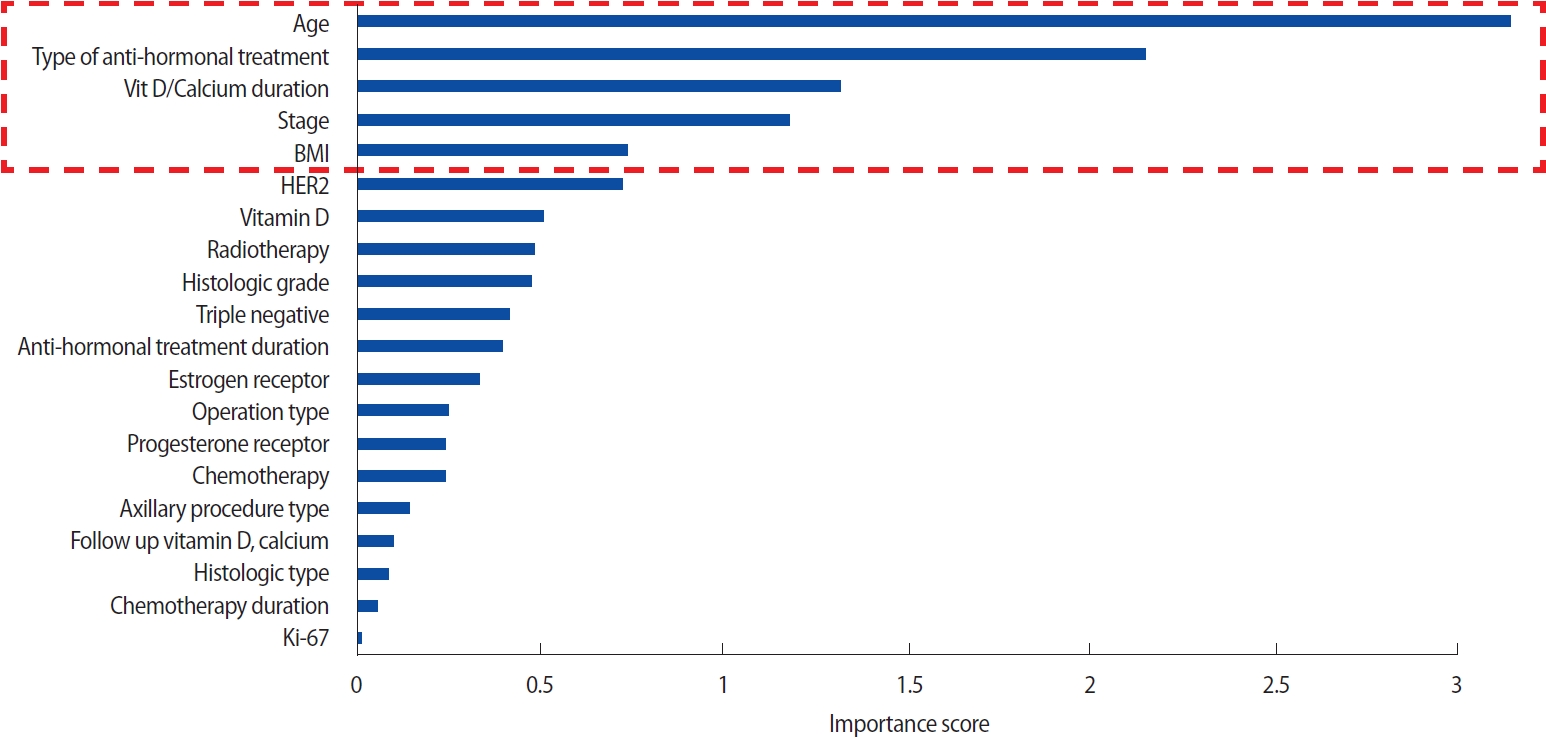
PLS-DA has been used to classify the high-dimensional input data based on the pre-defined class labels [18]. We chose PLS-DA because it performs better with categorical data than other feature selection methods such as random forest or support vector machines [19]. PLSDA generates variable importance value (VIP) scores for all variables. Variables that contributed significantly to classifying patients into the three groups were ranked with high VIP scores. The top five variables selected after performing PLS-DA were age, HTx, duration of vitamin D or calcium intake (Vit D + Ca duration), pathological cancer stage (pStage), and BMI (Figure 1). The overall patterns of the patient’s clinical status for the top five variables are shown in Figure 2.
Discovering the clinical patterns of interest using clustering algorithm
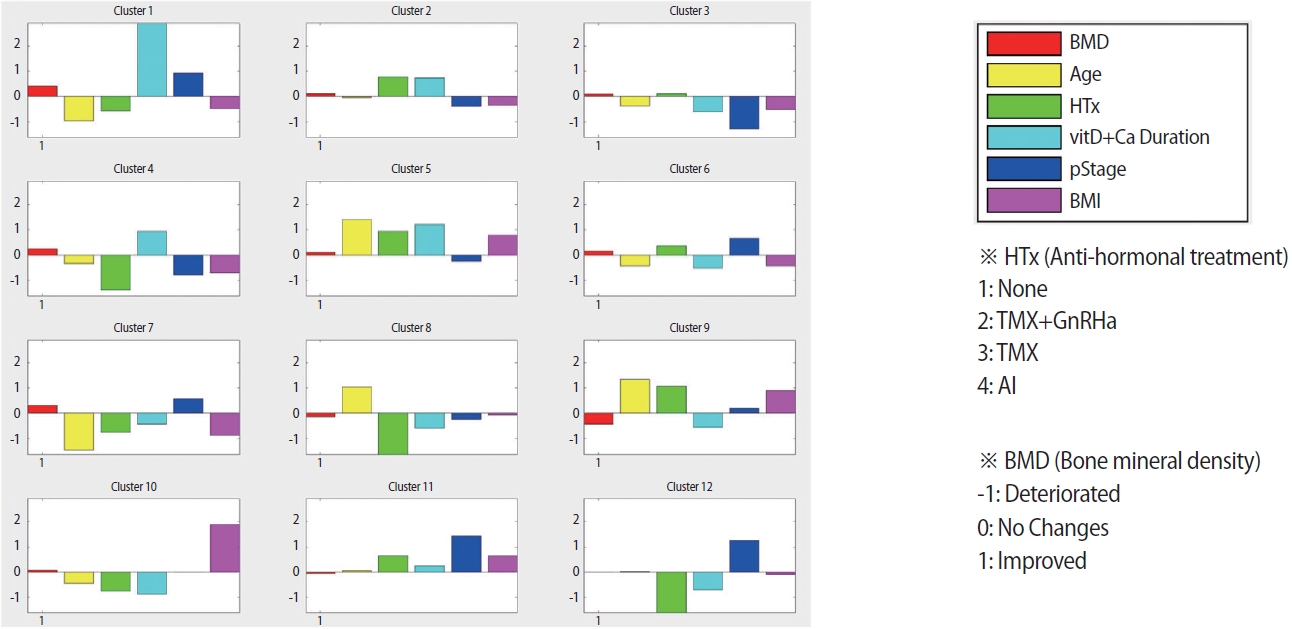
To identify patients’ clinical patterns for the top five selected variables, SOM, an unsupervised clustering algorithm, was used. Among the clustering algorithms, such as hierarchical clustering or k-means clustering, SOM has been widely used for the analysis of large clinical datasets owing to its capability in the classification of categorical data and the interpretability of the results. A 3×4 grid structure was adopted for the output of the SOM results to enhance interpretability, which was suitable for identifying clinically meaningful subgroups. Six SOM input variables (the top five variables and TBS) were used to examine the clinical patterns of the selected variables in terms of TBS change. Consequently, 12 clusters were generated after performing SOM, and patients with similar clinical patterns across the six variables were grouped into the same cluster. The number of patients in each cluster is shown in Figure 3, and the patterns of all clusters are presented in Figure 4. As we aimed to discover the patterns of clinical variables affecting TBS change, we specifically focused on three clusters of interest among the 12 clusters: (1) most improved, (2) no change, and (3) most deteriorated. Consequently, clusters 1, 12, and 9 were selected as the most improved, no change, and most deteriorated groups, respectively, for further study.
Heatmap clustering according to TBS change
The pattern of the TBS change was divided into three groups (improved, no change, deteriorated), and based on various clinicopathological information, heatmap analysis confirmed the characteristics of all patients (Figure 5). It can be confirmed that the clinicopathological characteristics of each patient in each group were not clearly distinguished and were heterogeneous.
DISCUSSION
The results of our study showed that the use of TMX or GnRHa in pre-menopausal patients with breast cancer was not clearly associated with decreasing BMD when administered vitamin D and/or calcium. The effect of TMX in pre-menopausal women differs from that associated with bone loss in previously published studies. However, these studies were mostly of small sample sizes and derived results using univariate analyses [7,20]. A recent study using a large national data cohort reported that TMX was not associated with decreased bone function in young patients aged <40 years with breast cancer in Korea [5]. Additionally, TMX significantly decreased the risk of osteoporosis and osteoporotic fractures in patients with breast cancer patients aged 40–49 years at the time of diagnosis. GnRHa use was significantly associated with an increased risk of osteoporosis in patients aged < 50 years. Chemotherapy and AI were significantly associated with the risk of osteoporosis and osteoporotic fractures in patients aged 40–49 years. Based on these previous findings, inconsistent results have been published in breast cancer patients regarding the use of anti-hormone drugs and their association with bone function.
This can be attributed to the fact that the clinical characteristics of individual patients with breast cancer are diverse and the study groups were different for each study. Research-based on machine-learning analysis has been used to find evidence using increasingly diverse big data from clinicopathological studies. The demographic characteristics of breast cancer patients (age, menstruation, etc.) are considered in determining the types of HTx. Therefore, in situations where demographic characteristics were likely to vary depending on the differences in HTx, this study tried a new analysis method of the clinicopathological factors in bone health in breast cancer patients using a machine-learning analysis and focused on the change in the TBS value itself rather than the occurrence of complications such as osteoporosis or osteoporotic fracture in bone health. The TBS change patterns were divided into three groups (improved, no change, and deteriorated). Heatmap analysis shows that the clinical factors of the enrolled patients were very heterogeneous. The PLS-DA technique was used to determine the association between bone health and clinicopathological factors. Five important factors associated with bone health through PLS-DA analysis including age, HTx, duration of vitamin D and/or calcium intake, pStage, and BMI were selected. It was previously reported that age and HTx are linked to bone health. Additionally, because vitamin D and calcium supplementation are used for bone health, it could be predicted that this variable would have a significant impact on bone health. It can be assumed that the importance of adjuvant therapy will be greater because the type of adjuvant therapy (especially chemotherapy related to bone health) varies depending on the pathological stage. BMI may be positively correlated with BMD, which is traditionally believed to protect patients from fracture [21]. This is mainly because a larger bone size induces an increase in areal BMD values from DXA [22]. Recently, the relationship between obesity and osteoporosis was established but controversies still exist among reported studies [23,24]. However, the current study did not discuss these discrepancies because most of the enrolled patients had normal BMD. Taken together, the results regarding the importance of using PLS-DA are acceptable.
The pattern was analyzed using the unsupervised clustering algorithm SOM by adding a factor called TBS change, which was a standard for dividing the three groups, and the top five variables were selected through PLS-DA. Of the 12 clusters, the three that best reflected the characteristics of each group were the most improved group (cluster 1), the no-change group (cluster 12), and the most deteriorated group (cluster 9).
When we analyzed the data of all the patients, older age was a significant factor for deteriorated bone status, as is commonly recognized. However, the results of the SOM subcategorization were different. We chose clusters 1, 12, and 9 for the change in TBS as the most improved, no change, and most deteriorated clusters, respectively. Interestingly, both the improved (92.3%) and deteriorated (87.5%) groups included patients who were treated with TMX and GnRHa. Our data demonstrate that the average age was higher in the improved group than in the deteriorated group. These results imply that the same treatment has different effects on patients based on their age and that aged patients are more resistant to the loss of bone quality.
This study aimed to determine the clinical efficacy of HTx on the quality of bone. Since there will be changes in bone health according to age changes in breast cancer patients, we tried including patients who did not receive HTx. Additionally, two patients with stage IV were included in this study (Table 1). In the case of these patients, surgical treatment was also performed, and HTx after surgery was not different from the treatment received in non-metastatic patients; therefore, so they were not excluded from this study. But the number of patients was too small to apply machine-learning methods, and the real-world data were too heterogeneous to be categorized. The traditional analytical results also showed that the characteristics were not significantly different according to change in TBS, except for the type of HTx, duration of HTx, and duration of calcium replacement. These results suggest that the real-world data are complex. Patients need to be managed in a more detailed protocol, and a comprehensive tool needs to be established for the cure of cancer, as well as to improve the quality of life of breast cancer patients.
TMX has been reported to have contradictory effects in pre-menopausal and post-menopausal women. Pre-menopausal patients are more vulnerable to bone health issues when TMX is used, and the combination of TMX with GnRHa accelerates bone loss [25]. In contrast , TMX has been reported to have a positive effect on post-menopausal women with hormone receptor-positive breast cancer in preclinical [26,27] and clinical studies [6,28,29]. However, from the current results, we could not clearly observe the difference or the positive or negative effects of TMX in pre- or post-menopausal women, as described in previous studies. These results may be attributable to data heterogeneity.
Our study’s strength is in the use of TBS but not BMD, which means that we have evaluated the quality of bone and adopted the definition of the change in bone status in the comparative results between changes in TBS and LSC. The TBS is a texture parameter that quantifies gray-level variations obtained from conventional DXA and has recently been accepted as an indirect evaluation of trabecular microarchitecture [30]. In a previous study on the LSC sensitivity of TBS and BMD with endocrine treatment of AI or TMX in post-menopausal breast cancer patients, TBS showed better sensitivity than BMD for detecting LSC [27]. Therefore, we concluded that we evaluated bone quality with more sensitive parameters for the change in bone status during hormonal therapy in patients with breast cancer.
This study has some limitations. Compliance with vitamin D or HTx may affect bone health outcomes which this study did not examine. The number of patients included in this study was rather small (244 patients), and the number of anti-hormonal medication treatment or dosing periods, evaluation of bone quality, short monitoring period, and high heterogeneity of the subjects are considered the additional limitations of this study. Therefore, additional research is needed to extend the dosing and bone quality evaluation periods. Such efforts could be a small stepping-stone for personalized characterization therapy.
In summary, our study evaluated the clinical associations between HTxs for various clinical conditions and bone health in Korean women with breast cancer. However, owing to the relatively small size of the data, we found that the results were heterogeneous, inducing a clinical conclusion. Additional data should be collected in future studies.