Necessity of In Situ Hybridization Test of Human Epidermal Growth Factor Receptor 2 (HER2) Status in Breast Cancer Patients with Equivocal HER2 Immunohistochemistry Results
Article information
Abstract
Purpose
Accurate human epidermal growth factor receptor 2 (HER2) status is important in predicting prognosis and providing treatment for HER2-positive breast cancer patients. However, performing in situ hybridization (ISH) can be an economic burden on developing countries. This study aimed to find an alternative to the ISH test by predicting the HER2 status in patients with equivocal immunohistochemistry (IHC) results.
Methods
We retrospectively reviewed the clinical data of 15,535 patients who underwent curative surgery for invasive breast cancer between February 2005 and April 2015 at the Samsung Medical Center. Equivocal HER2 IHC results were obtained for 461 patients. Logistic regression analysis using stepwise selection was performed to identify the clinicopathological factors related to silver in situ hybridization (SISH) status. We analyzed the data by dividing the estrogen receptor and progesterone receptor (PR) into three groups according to Allred score.
Results
Multivariable analysis identified poorly differentiated histological grade, lower PR score, higher expression of Ki-67 and p53, and lower expression of cytokeratin 5/6 and epidermal growth factor receptor as predictors of SISH-positive results. The area under the curve for the receiver-operating characteristic curve was 0.74.
Conclusion
We identified factors related to a positive HER2 status by SISH. However, there was insufficient power in the prediction model for diagnosis and evaluation. Therefore, the SISH test is essential in determining the HER2 status of breast cancer patients when the IHC result is equivocal.
INTRODUCTION
Breast cancer is the second most common cancer in the world, with an estimated 1.67 million new cases diagnosed in 2012. This represents approximately 25% of all cancers and 12% of all new cancer cases in women. Of these, 651,000 new patients were diagnosed in Asia and the incidence of breast cancer per 100,000 individuals is 29. Breast cancer is the most common cause of cancer death in women in developing countries (14.3%) and the second most common cause of cancer death in developed countries (15.4%). In 2012, 231,000 patients died from breast cancer in 2012 [1].
Breast cancer is a heterogeneous disease in that the diagnosis, treatment, and prognosis differ by molecular subtype rather than by a single characteristic of the disease [2]. In clinical practice, breast cancer subtypes are defined according to the recommendations of the 13th St. Gallen International Breast Cancer Conference [3]. Breast cancer subtypes differ by the statuses of estrogen receptor (ER), progesterone receptor (PR), human epidermal growth factor receptor 2 (HER2), and the level of Ki-67 according to immunohistochemistry (IHC). Multiple studies have reported that including cytokeratin 5/6 (CK5/6) and epidermal growth factor receptor (EGFR) in the IHC panel enables a more specific molecular subtyping [4].
Approximately 15% to 20% of breast cancers are HER2 positive [5]. Before the introduction of HER2-targeted agents, HER2 positivity was associated with increased rates of metastasis, shorter time to relapse, and greater disease mortality [6]. HER2-targeted agents have a significant survival benefit in patients with HER2-positive breast cancer in adjuvant, neoadjuvant, and metastatic settings [7]. Therefore, determining an accurate HER2 status is important in predicting prognosis and providing optimal treatment for HER2-positive breast cancer patients [8].
The American Society of Clinical Oncology (ASCO) and the National Comprehensive Cancer Network recommend adjuvant chemotherapy with trastuzumab in high-risk HER2-positive disease [9,10]. The measurement of HER2 usually begins with IHC and progresses to in situ hybridization (ISH) testing if the IHC score is 2+ (equivocal) [11]. Therefore, equivocal IHC results have an important role in optimizing methods to assess HER2 status, since a binary decision must be made regarding target treatments that are potentially beneficial but very expensive and have a risk of cardiotoxicity [11,12].
However, ISH methods have some disadvantages. Performing ISH can be an economic burden on a community or patient in developing countries [13]. Additionally, it has been reported that HER2 equivocal cases can result in different HER2 status assessments depending on the ISH assays used and the selection of scoring criteria [14]. Furthermore, chemotherapy can induce an increase in HER2 gene copy numbers, which means that pathologists may have difficulty assessing the HER2 status with the HER2 ISH assay in patients treated with neoadjuvant chemotherapy [15].
The aim of this study was to analyze factors for silver ISH (SISH)-positive status in breast cancer patients with equivocal IHC results. By identifying these factors, we should be able to predict which patients are able to omit the ISH test when the IHC result is equivocal. Representative demographic and clinicopathological data were used for the analysis [16].
METHODS
Patient characteristics
Approval was granted by the Institutional Review Board of the Samsung Medical Center, Seoul, South Korea (IRB file No. 2016-12-138). Patient records and information were anonymized, and identification was removed before analysis to protect personal information. We retrospectively reviewed the clinical data of 15,535 consecutive patients who underwent curative surgery for invasive breast cancer between February 2005 and April 2015 at the Samsung Medical Center. Patients who received neoadjuvant chemotherapy or those with male breast cancer were excluded. After excluding patients with incomplete data, 521 cases with equivocal HER2 status by IHC were analyzed.
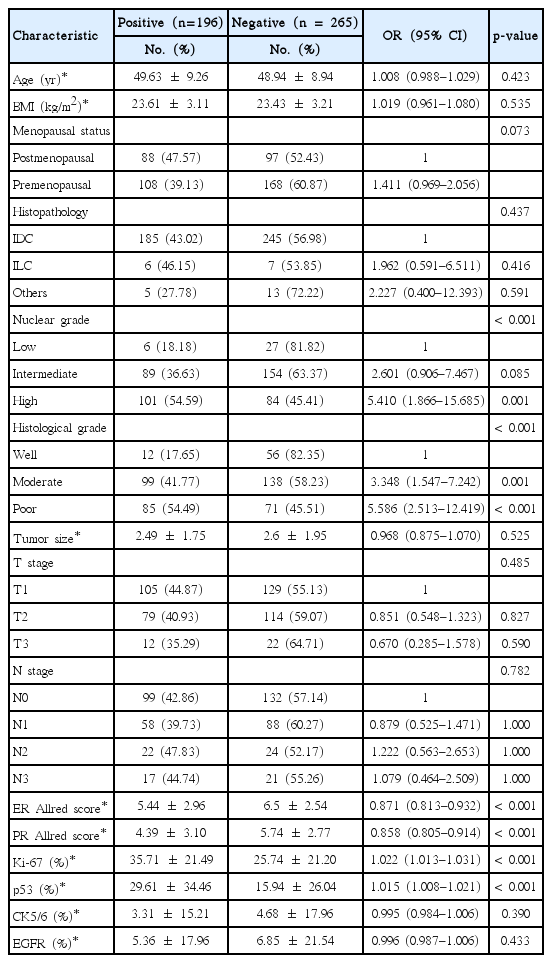
The demographic and clinicopathological data abstracted from medical records included age, body mass index, menopausal status, histopathology, nuclear grade (NG), histologic grade (HG), pathologic tumor stage (pT), pathologic nodal stage, ER and PR Allred scores, HER2 status by SISH, and Ki-67 expression level. In total, 461 cases had full records with expression levels of p53, CK5/6, and EGFR (Table 1). These data were used for analysis.
Demographic and clinicopathological characteristics of the study population
We analyzed the data by dividing the ER and PR into three groups according to Allred score as follows: low, 0–1; intermediate, 2–6; and high, 7–8.
Subgroup analysis was performed for patients who were strongly positive for both ER and PR (Allred score 7 or 8). In total, 216 patients were included in this subgroup analysis. This study was performed to identify the possibility of distinguishing luminal A subtype and HER2-positive luminal B subtype.
HER2 testing
HER2 status by IHC was evaluated according to the recommendations of the 2007 ASCO/College of American Pathologists (CAP) before November 2013 and 2013 ASCO/CAP after November 2013 [11,12]. Circumferential membrane staining that was complete, intense, and within >10% of tumor cells was scored “3+.” Circumferential membrane staining that was complete and circumferential membrane staining that was intense and within ≤10% of tumor cells or incomplete and/or weak/moderate and within >10% of tumor cells was “2+.” Incomplete membrane staining that was faint or barely perceptible and within >10% of tumor cells was “1+.” If no staining was observed or membrane staining was incomplete and faint or barely perceptible and within ≤10% of tumor cells, the resulting score was “0.” A score of 3+ was interpreted as positive. An equivocal test was defined as staining with a 2+ score. A score of 0/1+ was interpreted as negative. Before November 2013, the cutoff value of tumor cells was 30% instead of 10%.
ISH findings were also evaluated using the recommendations of the 2007 ASCO/CAP before November 2013 and 2013 ASCO/CAP after November 2013 [11,12]. HER2 amplification was defined as positive when the HER2/centromeric probe for chromosome 17 (CEP17) ratio was ≥2.0 and/or the average HER2 copy number was ≥6.0 signals/cell. HER2 amplification was defined as equivocal when the HER2/CEP17 ratio was <2.0 with an average HER2 copy number of ≥4.0 and <6.0 signals/cell. HER2 amplification was defined as negative when the HER2/CEP17 ratio was <2.0 with an average HER2 copy number of <4.0 signals/cell. Before November 2013, an HER2/CEP17 ratio for positive HER2 amplification was ≥2.2, negative was <1.8, and equivocal was ≥1.8 and <2.0.
IHC testing for other biomarkers
ER, PR, p53, EGFR, and CK5/6 were analyzed immunohistochemically using antibodies prepared against these proteins. We applied an anti-ER and anti-PR monoclonal antibody to 10% neutral buffered formalin-fixed and paraffin-embedded tissue. Only nuclear staining was scored. Positive staining of ≥1% of tumor cells was defined as a positive test.
p53 IHC staining was performed using an anti-human monoclonal p53 antibody. When assessing each section, nuclear staining >10% was regarded as positive. IHC for EGFR was interpreted as “positive” or “negative” according to the degree of membrane staining with a cutoff value of 10%. CK5/6 staining was regarded as positive if any membranal and/or cytoplasmic staining was observed.
Statistical analysis
Statistical analysis was conducted using SAS software version 9.4 (SAS Institute, Cary, USA). Logistic regression analysis was performed to identify clinicopathologic factors related to SISH status. Stepwise selection was used to select predictors for multivariable analysis. The odds ratios (ORs) were estimated with 95% confidence intervals (CIs). Statistical significance was set at p<0.05. A receiver-operating characteristic (ROC) curve was analyzed to evaluate the models in this study [17].
RESULTS
Overall, 461 patients had equivocal HER2 IHC results without missing data. Higher NG (OR, 5.410; 95% CI, 1.866–15.685), moderately differentiated HG (OR, 3.348; 95% CI, 1.547–7.242), poorly differentiated HG (OR, 5.586; 95% CI, 2.513–12.419), lower ER (OR, 0.871; 95% CI, 0.813–0.932) and PR (OR, 0.858; 95% CI, 0.805–0.914) Allred scores, and higher expression of Ki-67 (OR, 1.022; 95% CI, 1.013–1.031) and p53 (OR, 1.015; 95% CI, 1.008–1.021) were predictors of SISH-positive results in patients with equivocal HER2 IHC (Table 1).
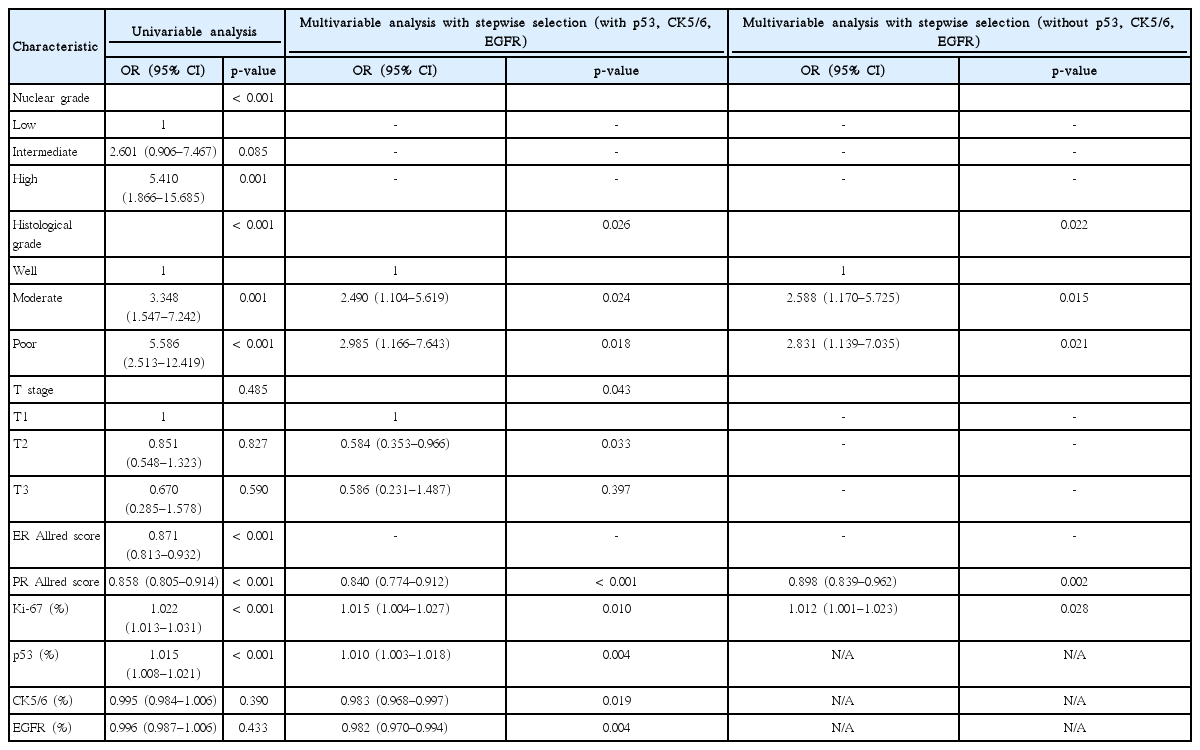
Multivariable analysis with stepwise selection identified moderately differentiated HG (OR, 2.490; 95% CI, 1.104–5.619), poorly differentiated HG (OR, 2.985; 95% CI, 1.166–7.643), pT2 (OR, 0.584; 95% CI, 0.353–0.966), lower PR Allred score (OR, 0.840; 95% CI, 0.774–0.912), higher expression of Ki-67 (OR, 1.015; 95% CI, 1.004–1.027) and p53 (OR, 1.010; 95% CI, 1.003–1.018), and lower expression of CK5/6 (OR, 0.983; 95% CI, 0.968–0.997) and EGFR (OR, 0.982; 95% CI, 0.970–0.994) as predictors of SISH-positive results. When p53, CK5/6, and EGFR were excluded from the dataset, moderately differentiated HG (OR, 2.588; 95% CI, 1.170–5.725), poorly differentiated HG (OR, 2.831; 95% CI, 1.139–7.035), lower PR Allred score (OR, 0.898; 95% CI, 0.839–0.962), and higher expression of Ki-67 (OR, 1.012; 95% CI, 1.001–1.023) were related to SISH-positive results by multivariable analysis with stepwise selection (Table 2).
Independent predictors of positive SISH results
The area under the curve (AUC) for the ROC curve was 0.740 (95% CI, 0.695–0.785) and the generalized coefficient of determination was 21.41%. After excluding p53, CK5/6, and EGFR from the analysis, the AUC for the ROC curve was 0.683 (95% CI, 0.635–0.731), and the generalized coefficient of determination was 12.47%. Including p53, CK5/6, and EGFR in the prediction model improved the power for diagnosis and evaluation (p=0.003) (Figure 1).
Area under the curve for the receiver-operating characteristic curve, (A) including p53, cytokeratin 5/6 (CK5/6), and epidermal growth factor receptor (EGFR) and (B) excluding p53, CK5/6, and EGFR.
ER and PR statuses were categorized into low, intermediate, and high groups according to their Allred score. Multivariable analysis with stepwise selection was performed after the grouping. The results were similar to those before categorization, except for ER and PR statuses. The high ER (OR, 3.166; 95% CI, 1.414–7.091) and PR groups (OR, 1.794; 95% CI, 1.047–3.075) were identified as predictors of SISH-positive results. After excluding p53, CK5/6, and EGFR from the dataset, the results were similar except for ER and PR statuses. High ER (OR, 2.540; 95% CI, 1.195–5.400) and PR Allred scores (OR, 1.692; 95% CI, 1.003–2.855) were related to SISH-positive results by multivariable analysis with stepwise selection (Table 3).

Independent predictors of positive SISH results when ER and PR is divided in three subgroups by Allred score
The AUC for the ROC curve was 0.750 (95% CI, 0.705–0.795) and the generalized coefficient of determination was 23.97%. After excluding p53, CK5/6, and EGFR from the analysis, the AUC for the ROC curve was 0.705 (95% CI, 0.658–0.752), and the generalized coefficient of determination was 15.81%. Including p53, CK5/6, and EGFR in this prediction model improved the power of the diagnosis and evaluation (p=0.008) (Figure 2).
Area under the curve for the receiver-operating characteristic curve, (A) including p53, cytokeratin 5/6 (CK5/6), and epidermal growth factor receptor (EGFR) and (B) excluding p53, CK5/6, and EGFR when estrogen receptor and progesterone receptor are divided into three subgroups by Allred score.
Subgroup analysis was performed on the data of 216 patients who were strongly positive for both ER and PR. Multivariable analysis with stepwise selection identified that higher expression of Ki-67 (OR, 1.032; 95% CI, 1.015–1.049) and p53 (OR, 1.014; 95% CI, 1.002–1.026) were predictors of SISH-positive results. When p53, CK5/6, and EGFR were excluded from the dataset, higher expression of Ki-67 (OR, 1.035; 95% CI, 1.019–1.052) only showed a relationship with SISH-positive results by multivariable analysis with stepwise selection (Table 4).

Independent predictors of positive SISH results in strong ER, PR positive groups
The AUC for the ROC curve was 0.751 (95% CI, 0.684–0.818) and the generalized coefficient of determination was 15.38% in the subgroup analysis where ER and PR were strongly positive. After excluding p53, CK5/6, and EGFR from the analysis, the AUC for the ROC curve was 0.723 (95% CI, 0.652–0.794) and the generalized coefficient of determination was 12.11%. Including p53, CK5/6, and EGFR in the prediction model did not improve the power of the diagnosis and evaluation (p=0.220) (Figure 3).
Area under the curve for the receiver-operating characteristic curve, (A) including p53, cytokeratin 5/6 (CK5/6), and epidermal growth factor receptor (EGFR) and (B) excluding p53, CK5/6, and EGFR in strongly positive estrogen receptor and progesterone receptor groups.
DISCUSSION
IHC is much easier to perform than ISH and is generally less expensive in many countries [13,18]. Most pathology laboratories can perform IHC without external help or resources. In contrast, only specialized laboratories are able to perform ISH because of the specialized equipment and training required [18]. Furthermore, the cost of the ISH test is 2 to 4 times higher than that of IHC [13]. For this reason, many surgical pathology laboratories first measure HER2 using IHC and progress to ISH testing only if IHC is equivocal [19].
In October 2013, ASCO and CAP updated the guidelines issued in January 2007 for HER2 testing in breast cancer [11,12]. According to the previous 2007 HER2 guideline, the threshold of HER2 equivocal breast cancer using IHC is defined as complete circumferential membrane staining that is weak or moderate and >10% of invasive tumor cells. The recent update of ASCO/CAP guidelines in 2013 includes a widened threshold to reduce the false-positive rate of HER2 results. Circumferential membrane staining that is incomplete and/or weak or moderate and >10% of the invasive tumor cells or complete circumferential membrane staining that is intense and ≤ 10% of the in vasive tumor cells are now categorized as HER2 equivocal. Equivocal results obtained with IHC require a reflex test with the same specimen using ISH or a new test with a new specimen using IHC or ISH. This change in ASCO/CAP guidelines for HER2 testing increases the proportion of reflex ISH tests and HER2-positive breast cancers [20].
Although a combination of IHC and ISH is the current standard method to measure HER2 status, it is not an absolute method to detect HER2 expression. IHC results can change depending on antibodies, fixatives, and technical assessment. IHC staining is easy to perform and relatively inexpensive to detect HER2 status; however, the results are ambiguous because they show inter- and intra-laboratory variability in sensitivity and specificity [21]. Moreover, HER2 status assessment can differ depending on the ISH assays used and the selection of scoring criteria [14]. In addition, an increase in HER2 gene copy numbers can be induced by chemotherapy, which means accurately assessing HER2 status in patients treated with neoadjuvant chemotherapy may be challenging for pathologists [15].
Recently, more methods have been introduced to assess the HER2 gene accurately. Dual in situ hybridization (DISH) is a new bright-field ISH method recently approved by the U.S. Food and Drug Administration to determine HER2 gene status. The HER2 DISH assay is performed only through an automated protocol and is analyzed under a bright field microscope. Signal preservation on the HER2 DISH slides is superior to HER2 FISH slides and tissue morphology assessment is easier than on chromogenic assays [22]. Real-time quantitative reverse transcription polymerase chain reaction (RT-qPCR) is currently being tested as a method for measuring HER2 status. The RT-qPCR method detects HER2 status at the level of gene copy number and relative messenger RNA expression. This fast, simple, and quantitative approach provides a viable alternative for the evaluation of HER2 gene alteration in routine clinical practice [21].
In the present study, we focused on predicting patients who could omit the ISH test when their IHC results were equivocal. We found that poorly and moderately differentiated HG, lower PR Allred score, higher expression of Ki-67 and p53, and lower expression of CK5/6 and EGFR were predictors of SISH-positive results. However, NG and T stage did not show any statistical significance. When ER and PR Allred scores were categorized into three groups, patients with both high ER and PR Allred scores were associated with SISH-positive results. From this result, we narrowed down the population to those who had high ER and PR Allred scores. We hoped to find a method of distinguishing luminal A and HER2-positive luminal B subtypes. Higher expression of Ki-67 and p53 were predictors of SISH-positive results in this group of patients, while NG, HG, T stage, CK5/6, and EGFR did not show any statistical significance. When excluding p53, CK5/6, and EGFR from the analysis of patients with strongly positive ER and PR Allred scores, higher expression of Ki-67 was the only parameter that showed a relationship with SISH-positive results. According to this result, Ki-67 was the only factor distinguishing luminal A and HER2-positive luminal B subtypes in SISH-positive patients.
In this study, ER and PR showed contradictory results in predicting HER2 status before and after categorizing ER and PR into three groups according to Allred score. This is probably because the ER and PR Allred scores of patients were not evenly distributed between 0 and 8. Most patients had scores of 7 or 8, which corresponds to the “high” group. In this study, 69.9% (ER) and 48.8% (PR) of the total patients were in the “high” group.
In previous studies from our group, ER, PR, HER2, Ki-67, p53, CK5/6, and EGFR were routinely checked at our center [23,24]. p53 is a tumor-suppressor gene that can induce apoptosis after DNA damage [25]. p53 overexpression has been found to be related to aggressive features of breast cancer, and the prognostic significance of p53 overexpression has been reported in other studies [24]. p53 mutations can lead to a loss of function of the p63 gene that causes amplification of the EGFR gene [26]. EGFR can promote tumor cell migration and is associated with tumor aggressiveness [23]. Overexpression of EGFR in HER2-positive breast cancer is a poor prognostic factor but it is a predictive factor for trastuzumab response [27]. Expression of either EGFR or CK5/6 has been reported to accurately identify a basal-like subtype of breast cancer [4].
When IHC results are equivocal, the HER2 positive rate by ISH is known to be approximately 30% [28]. In our study, the HER2 positive rate was approximately 40%. We considered that this difference might be because a large proportion of patients involved in our research were evaluated using the 2013 ASCO/CAP guideline [11], and that SISH was the method of ISH rather than FISH [29].
In this study, we identified factors related to an HER2-positive status by SISH when the IHC result was equivocal. The AUC for ROC was improved when p53, CK5/6, and EGFR were analyzed together (0.740 vs. 0.683, p=0.003). However, the AUC of this prediction model was insufficient for use in a clinical setting [30]. Neither regrouping the population by low, intermediate, and high ER and PR nor narrowing the study population to strongly positive ER and PR groups resulted in sufficient evaluation power. Although we attempted to predict HER2 status in breast cancer patients with equivocal IHC results, the ISH test could not be omitted for determining HER2 status if the IHC result was equivocal.
Notes
The authors declare that they have no competing interests.