MR Imaging Findings and Texture Analysis of Pure and Mixed Mucinous Breast Carcinoma
Article information
Abstract
Purpose
To evaluate the ability of magnetic resonance imaging (MRI) findings and texture features to differentiate between pure and mixed subtypes of mucinous breast carcinoma.
Methods
This retrospective study included 136 patients who were surgically diagnosed with mucinous breast carcinoma and underwent pre-treatment breast MRI between January 2008 and December 2020. All clinicopathological and MRI features were reviewed. For texture analysis, regions of interest of the tumors were drawn manually on T2-weighted images and first-subtraction T1-weighted images. Texture feature extraction and analysis were conducted using open-source 3D slicer software. Univariate and multivariate analyses were used to identify significant MRI findings and texture features to differentiate between the two subtypes. To evaluate the diagnostic performance of the texture features, a receiver operating characteristic curve analysis was conducted.
Results
Among the MRI findings, very high signal intensity on T2-weighted images was significantly associated with pure mucinous breast carcinoma (odds ratio=5.23, p=0.001). The homogeneity and skewness texture features from T2-weighted imaging showed statistically significant differences between pure and mixed subtypes, and the areas under the receiver operating curve were 0.749 and 0.815, respectively.
Conclusion
Signal intensity and texture features on T2- weighted images derived from breast MRI can assist in the differential diagnosis of pure and mixed types of mucinous breast carcinoma.
INTRODUCTION
Mucinous carcinoma is a rare type of breast cancer with an incidence of 1%−7% [1]. Mucinous carcinomas can be classified into two histopathological subtypes: pure and mixed. Based on tumor cellularity, pure mucinous carcinoma is diagnosed when at least 90% mucinous component is present and mixed mucinous carcinoma, when there is less than 90% mucin and other invasive components without mucin [2]. Pure mucinous carcinoma exhibits less aggressive behavior and a lower probability of axillary lymph node metastasis than the mixed type. Conversely, mixed mucinous carcinomas intermixed with non-mucinous components, such as invasive carcinomas of no special type, exhibit a less favorable prognosis. The reported 10-year survival rates are 87%−90%, and 54%−66% for the pure and the mixed types, respectively [3, 4]. The treatment plans and prognoses may differ; therefore, preoperatively distinguishing between the two forms of mucinous carcinoma may be beneficial.
Mucinous carcinoma is known to have characteristic magnetic resonance imaging (MRI) features, such as a lobular shape, very high signal intensity on T2-weighted images, and a persistent kinetic enhancement pattern on delayed-phase images due to its rich mucin component [5-8]. Although few studies have reported that pure mucinous carcinomas can be differentiated from mixed mucinous carcinomas using MRI, they used a small number of mixed mucinous carcinomas [6, 8].
Texture analysis is an emerging quantitative feature analysis method for imaging in various fields of oncology that identifies image patterns that are difficult to discern with unaided human eyes [9]. Textures are repeating patterns of spatial location and gray-level signal intensity of pixels in radiological images that are visually undetectable in terms of uniformity, density, and coarseness [9,10]. A large volume of image data is derived from breast MRI examinations, and additional computer-assisted mathematical procedures can be used to extract various texture features of breast cancer. Several studies have conducted texture analyses using breast MRI to distinguish benign from malignant lesions, characterize breast tumor subtypes, and assess the treatment response or tumor recurrence of invasive breast cancer [9,11,12]. Few studies have investigated the association between MRIbased texture analysis-derived parameters and the two subtypes of mucinous carcinoma. We hypothesized that both qualitative and quantitative imaging features extracted from MR images might reveal notable differences between pure and mixed mucinous carcinomas.
The present study aimed to compare the MRI findings and MRI-based texture analysis-derived parameters of pure and mixed mucinous carcinoma and to examine whether they can be used to differentiate the subtypes of mucinous breast carcinoma.
METHODS
Patients
All pretreatment MRI scans of patients surgically diagnosed with mucinous carcinoma between January 1, 2008, and December 31, 2020, at our institute were retrospectively reviewed. Among the 198 patients, 34 with a prior excision or vacuum-assisted biopsy and 19 who had not undergone breast MRI were excluded from the study. Due to factors that may affect texture features, such as the lack of subjected sequences and different imaging protocols, eight patients who had undergone MRI outside our institution were excluded. One patient who underwent breast MRI with a 1.5-Tesla scanner was excluded. The final study population comprised 136 patients; the flowchart of patient selection is shown in Figure 1.
Flowchart of the study population recruited.
Clinicopathological factors, including patient’s age, detection method (screening or clinical evaluation of presenting symptom), family history, surgery type (breast conserving surgery or mastectomy), tumor size, histologic subtype and grade of the tumor, lymph node metastasis, lymphovascular invasion, microcalcification, associated ductal carcinoma in situ, extensive intraductal component, Ki-67 (≥ 20% or < 20%), hormonal receptor status of estrogen receptor (ER) and progesterone receptor (PR), and human epidermal growth factor receptor 2 (HER2) positivity were recorded. Ki-67 expression was scored as high and low with nuclear staining of at least 20% and less than 20%, respectively. The hormonal status of ER and PR positivity was assessed using the Allred scoring system [13]. Tumors with Allred scores greater than or equal to 3 were considered positive. HER2-negative and -positive statuses were defined as HER2 scores of 0/1+ and HER2 score 3+, respectively. Carcinomas with a HER2 score of 2+ were retested for HER2 gene amplification using the silver-enhanced in situ hybridization method to determine the HER2 positivity. This retrospective study was approved by the Institutional Review Board of our hospital (IRB No. CNUHH-2021-056); the requirement for informed consent was waived.
MRI technique
Bilateral breast MRI was performed in the prone position using three different 3-Tesla scanners (Tim Trio, Skyra, and Skyra II; Siemens Healthcare, Erlangen, Germany) and a dedicated minimum four-channel coil. The protocol included axial fat-saturated turbo spin-echo T2-weighted images (repetition time [TR]/echo time [TE], 3840/70 ms; field of view [FOV], 340×340 mm2; matrix size, 384×286 mm; and slice thickness, 2 mm) and axial fat-saturated spoiled gradient echo dynamic contrast-enhanced (DCE) T1-weighted images (TR/TE, 4.5/1.7 ms; FOV, 320×320 mm2; matrix size, 448×358 mm; and slice thickness, 1.5 mm). DCE-MRI included one unenhanced and five contrast-enhanced series, with each series at 60-s intervals using IV injections of gadoterate meglumine (Dotarem; Guerbet, Aulnay-sous-bois, France) at a dose of 0.1 mmol/kg body weight. Post-processing subtraction was automatically performed by subtracting unenhanced images from each contrast-enhanced sequence, creating five subtraction series. Maximum-intensity projection images were acquired. A commercially available post-processing computer-aided detection system (CADstream, version 6.0; Confirma, Kirkland, WA, USA) was used to analyze contrast enhancement kinetics.
Interpretation of MRI findings
Breast MR images were retrospectively reviewed by two radiologists and reported after arriving at a consensus. The findings were interpreted based on the following: morphology (mass or non-mass enhancement [NME]), mass size, mass shape (oval/round or irregular), mass margin (circumscribed or not circumscribed [irregular or spiculated]), and internal enhancement of the mass (homogeneous, heterogeneous, or rim). For NME lesions, the distribution (focal, linear, segmental, regional, multiple, and diffuse) and enhancement (homogeneous, heterogeneous, clumped, and clustered rings) were assessed. For all masses and NME lesions, signal intensity on T2WI (iso, high, and very high) and delayed kinetic patterns (persistent, plateau, and washout) were assessed. The fibroglandular tissue and background parenchymal enhancement were also assessed. All tumor morphological features were classified according to the Breast Imaging Reporting and Data System MR lexicon [14].
Texture analysis
Texture analysis was performed using axial pre-contrast fat-suppressed T2-weighted images (T2) and first axial subtraction images (SUB). SUB images were obtained by subtracting the pre-contrast image from the first post-contrast image to differentiate truly enhancing structures by suppressing the high signal intensity of fat and obtaining better imaging contrast between structures [15,16]. The T2 and SUB images were uploaded in Digital Imaging and Communications in Medicine format. The region of interest (ROI) was manually drawn by one radiologist. The radiologist delineated the tumor margin using these two sequences with a free and publicly available software package (3D slicer, ver. 4.13; https://slicer.org/) (Figure 2). Fourteen tumors were excluded upon feature extraction because of the difficulty in delineating the ROI margins or the unclear boundary of the NME or mass on both T2 and SUB. Four tumors on T2 and one tumor on SUB were also not available for manual segmentation by the 3D slicer software and were subsequently excluded.
A 78-year-old woman with pure mucinous carcinoma in the left breast. (A and B) Axial fat-suppressed T2-weighted (A) and first post-contrast subtraction T1-weighted image (B) show a 1.6×1.3×1.5-cm irregular mass with very high T2 signal intensity in the left breast. (C) 3D slicer segmentation of axial T2-weighted image shows a manually delineated tumor. (D) An example of automatically extracted radiomics features from segmented region of interest (ROI) using a 3D slicer software. Texture analysis automatically extracted texture feature from the ROI.
After manual segmentation of the ROIs on T2 and SUB images, 58 radiomic features commonly used in texture analysis studies were automatically obtained using a 3D slicer: first-order (18 features) and second-order statistics (40 features). First-order statistics included gray-level histogram features such as mean, median, variance, skewness, and kurtosis. Second-order features included a gray-level co-occurrence matrix (GLCM) and a gray-level run-length matrix (GLRLM) (Supplementary Table 1).
Statistical analysis
Clinicopathological and MRI features were compared between the pure and mixed subtypes using the chi-square test and Fisher’s exact test for categorical variables and the Mann–Whitney U test for continuous variables. Different texture factors between pure and mixed mucinous carcinomas were identified using Student’s t-test and the Mann–Whitney U test. Factors with a p-value < 0.05 were subjected to univariate and multivariate logistic regression (odds ratio [OR] with 95% confidence interval [CI]) analyses to identify the most expected differentiating features. To evaluate the diagnostic performance of the selected texture features, the area under the curve (AUC) of the receiver operating characteristic (ROC) curve, optimal cut-off value, sensitivity, and specificity were estimated.
Statistical significance was set at p< 0.05. All statistical analyses were performed using IBM SPSS Statistics for Windows, version 28.0 (IBM Corp., Armonk, NY, USA).
RESULTS
Patient characteristics and clinicopathological features
The clinicopathological characteristics of the pure and mixed mucinous carcinomas are summarized in Table 1. The age at diagnosis ranged from 27 to 93 years (mean age: 53 years). Clinical symptoms, such as a palpable breast mass or nipple discharge, were present in 79 patients (79/136, 58.1%). The remaining tumors were detected incidentally upon screening (57/136, 41.9%). Among the 136 patients, 110 underwent breast-conserving surgery (110/136, 80.9%), and the others underwent mastectomy (26/136, 19.1%). Postoperatively, 18 patients were diagnosed with mixed mucinous carcinoma (18/136, 13.2%). In 12 of these cases, mixed mucinous carcinoma was intermixed with invasive carcinoma of no special type (12/18, 66.7%), whereas the remaining six had micropapillary carcinoma (6/18, 33.3%).

Comparison of clinicopathological features of pure and mixed mucinous breast carcinomas
Mixed mucinous carcinomas showed a higher histological grade (p= 0.019) and larger tumor size (p= 0.045) than pure mucinous carcinomas. Mixed mucinous carcinomas had more lymph node metastases at the time of diagnosis (p< 0.001), more lymphovascular invasion, and microcalcification (p= 0.010 and 0.043, respectively) than pure mucinous carcinomas. The type of surgery was not significantly different between pure and mixed mucinous carcinomas (p= 0.749). Patient age; hormonal status of ER and PR; HER2 positivity, Ki-67; associated ductal carcinoma in situ; and extensive intraductal component were not different between the two groups (all p> 0.05).
MRI findings
The MRI features of pure and mixed mucinous carcinomas are summarized in Table 2. Both the carcinomas mostly presented as masses (124/136, 91.2%). Among the 124 tumors that presented as masses, significantly more pure mucinous carcinomas than mixed mucinous carcinomas had circumscribed margins (p= 0.036). Mixed mucinous carcinomas showed irregular shapes and heterogeneous enhancement (p= 0.040 and 0.006, respectively). In the 12 tumors presenting with NMEs, the distribution and enhancement patterns were not statistically significant (p= 0.056 and 0.802, respectively). The intratumoral T2 signal intensity and delayed kinetic patterns were significantly different between the pure and mixed types (both p< 0.001). Mixed mucinous carcinomas were less likely to exhibit very high T2 signal intensities than pure mucinous carcinomas (7/18, 38.9% vs. 102/118, 89.5%, p< 0.001). For kinetically delayed enhancement, most mixed mucinous carcinomas exhibited washout patterns (16/18, 88.9%), whereas pure mucinous carcinomas exhibited persistent and plateau patterns (41/118, 36.0% and 25/118, 21.9%, respectively) (Figures 3, 4). Fibroglandular tissue and background parenchymal enhancements were not statistically significant.

Comparison of MRI features of pure and mixed mucinous breast carcinomas

A 50-year-old woman with pure mucinous carcinoma in the left breast. (A-C) Axial fat-suppressed T2-weighted image (A) and axial fat-suppressed contrast-enhanced T1-weighted image shows a 1.7-cm mass (arrow, A and B) in upper inner left breast; this shows very high signal intensity on T2-weighted image and heterogeneous enhancement with persistent kinetic pattern (C). (D) Photomicrograph (H&E, ×2) shows nests of cells floating in large amounts of extracellular mucin.
A 63-year-old woman with mixed mucinous carcinoma in the left breast. (A-C) Axial fat-suppressed T2-weighted image (A) and axial fat-suppressed contrast-enhanced T1-weighted image shows a 2.2-cm mass (arrow, A and B) in upper inner left breast that shows mixture of iso- and high signal intensity on T2-weighted image and heterogeneous enhancement with washout kinetic pattern (C). (D) Photomicrograph (H&E, ×2) shows combined mucinous and invasive carcinoma of no special type.
Univariate and multivariate logistic regression analyses
In univariate analysis, histological grade 3 (OR, 95% CI=11.2, 2.27-55.33, p= 0.003), tumor size (>21 mm; OR, 95% CI =3.79, 1.27-11.33, p= 0.017), lymph node metastasis (OR, 95% CI =7.7, 2.66-22.29, p< 0.001), lymphovascular invasion (OR, 95% CI= 6.1, 1.67-22.01, p= 0.006), and microcalcification (OR, 95% CI =3.21, 1.16−8.88, p= 0.024) were significant. As regards MRI findings, the shape and margins of the mass, intratumoral T2 signal intensity, and delayed kinetics were significant on univariate analysis. Multivariate analysis showed that histological grade 3 (OR, 95% CI=7.83, 1.15−53.15, p= 0.035), lymph node metastasis (OR, 95% CI=7.54, 2.61-21.84, p< 0.001), and intratumoral T2 signal intensity (OR, 95% CI= 5.23, 1.64−65.47, p= 0.001) were significantly different between pure and mixed mucinous carcinoma (Table 3).
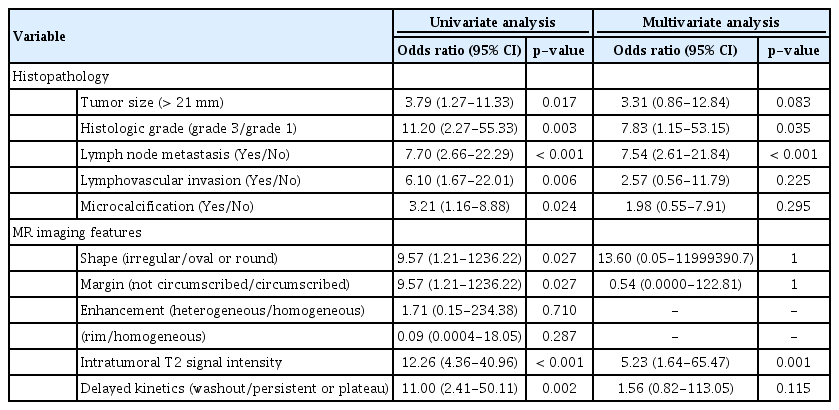
Results of logistic regression analysis of clinicopathogic and MRI features of pure and mixed mucinous breast carcinomas
Texture analysis
After manual segmentation of the ROI and automatic extraction of 58 radiomic features from T2 and SUB images, all features were normalized and statistical analysis was performed. In T2, the skewness, inverse difference moment normalized (IDMN), and inverse difference normalized (IDN) were significant (p= 0.003, 0.012, and 0.018, respectively). There were no significant radiomics features in the SUB (Table 4). All features were significantly higher in the mixed mucinous carcinoma group than in the pure mucinous carcinoma group. Using the ROC curve analysis, the thresholds, sensitivity, specificity, and AUCs for the selected texture features are summarized in Table 5. The skewness revealed good accuracy, with an AUC value of 0.815 when a cutoff value of 0.617 was chosen. The sensitivity and specificity were 77%. The IDMN and IDN showed fair accuracy, with AUC values of 0.766 and 0.749, respectively. The sensitivity was 69% for both, with a specificity of 69% for IDMN and 68% for IDN. The logistic regression model derived by combining all three texture features revealed better differentiation of mixed mucinous carcinomas from pure mucinous carcinomas, with an AUC value of 0.879, sensitivity of 77%, and specificity of 79%.
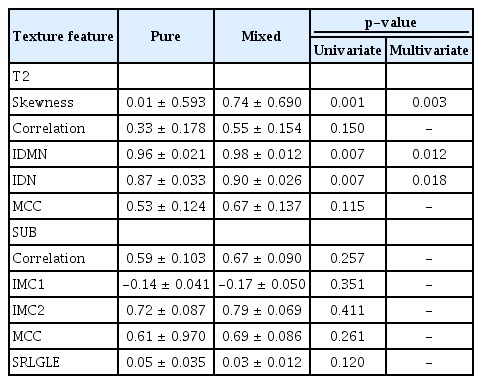
Association between mucinous carcinoma subtypes and texture features
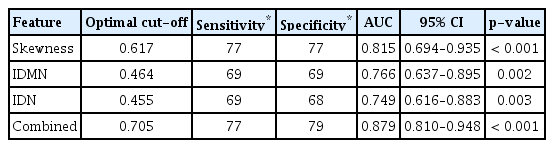
Performance of selected texture features on T2-weighted images and their combination
DISCUSSION
Mucinous carcinoma has some typical MRI features [7]; these imaging characteristics are mainly associated with the pure subtype of mucinous carcinoma. Nevertheless, several recent studies have evaluated the imaging findings of pure and mixed mucinous carcinomas with a relatively small number of mixed mucinous carcinomas [6,8,17].
Consistent with previous results, several MRI morphological features showed significant differences between the two subtypes in this study. Mixed mucinous carcinomas are more likely than pure mucinous carcinomas to have non-circumscribed margins and heterogeneous enhancement. Moreover, pure mucinous carcinomas are more likely to present with persistent kinetic patterns and very high T2 signal intensities. However, mixed mucinous carcinomas tended towards plateau and washout kinetic patterns and were less likely to show very high T2 signal intensities, with the difference being statistically significant.
Mucinous carcinomas are defined as tumors rich in extracellular mucin, which contributes to the high signal intensity equivalent to a water-filled cyst on T2-weighted images due to its long T2 relaxation time. Pure mucinous carcinomas have abundant mucoproteins in more than 90% of the tumor cells without a mixture of other invasive subtypes [18]. This large amount of mucus may also cause contrast medium diffusion through the tumor cell stroma and epithelium, resulting in gradual and persistent enhancement of pure mucinous carcinomas [17]. Conversely, mixed mucinous carcinomas contain smaller amounts of mucin and some non-mucinous components, primarily reported as invasive ductal carcinomas. The various proportions and distributions of non-mucinous invasive components may explain the heterogeneous enhancement and washout kinetic patterns of mixed mucinous carcinomas, similar to those of invasive ductal carcinomas [6,17].
We assumed that the texture features extracted from MRI showed noticeable differences between pure and mixed mucinous carcinomas. In this study, the skewness, IDMN, and IDN obtained from T2-weighted images revealed significant differences between pure and mixed mucinous carcinomas. Although we only included the first post-contrast subtraction T1-weighted image, there were no significant texture features in the subtraction T1-weighted images.
Skewness is defined as a measure of distribution symmetry in a histogram [9]. When the skewness of the normal distribution is zero, any symmetric data should exhibit a skewness that approximates zero. If the skewness is negative, the pixels in the image spread to the left of the mean. In other words, higher positive or negative skewness indicates greater asymmetry from the normal distribution. Mixed mucinous carcinoma was found to have a higher positive skewness than pure mucinous carcinoma. This indicates that the pixels in the image of mixed mucinous carcinoma are more likely to spread towards the right. The higher skewness may explain the heterogeneity of both the MRI signal intensity and the histopathological tumor environment of mixed mucinous carcinoma compared with that of pure mucinous carcinoma.
Skewness has proven to be a useful texture feature in disease evaluation, differential diagnosis, and treatment response prediction in many oncological diseases [19]. Chandarana et al. [20] concluded that skewness is a differentiating texture feature of renal tumors on MRI. In the field of breast oncology, Amano et al. [21] found skewness to be a differentiating factor for the degree of background parenchymal enhancement on MRI. Marcon et al. [22] showed that skewness is a distinguishing factor between normal, benign, and malignant lesions on breast ultrasound.
The other two selected features of IDMN and IDN showed AUC values of 0.766 and 0.749, respectively, and had a higher AUC value of 0.879 when combined with skewness. The IDMN and IDN are both GLCM features, which are the most commonly extracted texture features for MRI quantification. The GLCM encodes the frequency at which two voxels of specific gray-level intensities are positioned at a specified distance from each other, and IDMN and IDN reflect local homogeneity in gray-level co-occurrence [9]. GLCM texture features can serve as noninvasive biomarkers to predict response to neoadjuvant chemotherapy [9].
Our study had several limitations. First, this was a retrospective, single-center study with a relatively small sample size but with the largest number of subjects among previously reported studies on pure and mixed mucinous carcinoma. Second, inter-observer variability data were not collected because two radiologists reviewed the imaging characteristics in consensus. Another concern is that our study only included T2-weighted and subtraction T1-weighted images because a considerable proportion of our patients had not undergone diffusion-weighted MRI. Diffusion-weighted images have been reported to be valuable for distinguishing pure breast mucinous carcinoma from other types of breast malignancies [23]. In addition to intratumoral features, the texture parameters of the peritumor region, the area immediately surrounding the tumor, have recently been proposed as a possible feature characterizing tumor heterogeneity and a treatment response predicting factor [24,25]. Therefore, a follow-up study involving other imaging sequences of breast MRI and the peritumoral region with a larger sample size needs to be conducted.
In conclusion, our study demonstrated that signal intensity and texture features on T2-weighted imaging derived from breast MRI were significantly different between the two histopathological subtypes of mucinous carcinoma. The texture features of skewness and homogeneity on T2-weighted MRI showed good diagnostic performance in differentiating between the pure and mixed types. The results suggest that computer-aided image texture analysis is a feasible diagnostic technique that can assist conventional MRI in differentiating pure and mixed mucinous carcinomas and can serve as a practical source for artificial intelligence in precision medicine.
Notes
The authors declare that they have no competing interests.
SUPPLEMENTARY MATERIAL
Supplementary Table 1.
Representative Texture features