Diagnostic Value of Contrast-Enhanced Digital Mammography Versus Contrast-Enhanced MRI for Detecting Residual Disease After Neoadjuvant Chemotherapy for Breast Cancer
Article information
Abstract
Purpose
Preoperative evaluation of breast cancer using contrast-enhanced digital mammography (CEDM) has gained acceptance as a possible alternative to contrast-enhanced magnetic resonance imaging (CEMRI). We aimed to compare the diagnostic performance of CEDM and CEMRI for chemotherapeutic response in breast cancer patients who underwent neoadjuvant chemotherapy (NAC).
Methods
Fifty patients with invasive carcinoma who underwent both CEDM and CEMRI from November 2017 to October 2018 were included. The residual malignancy sizes after NAC were compared with the histopathological results. The diagnostic performance for detecting residual cancers was compared using Lin concordance and Pearson correlation coefficients.
Results
Fifty patients were included in this analysis. The mean tumor size after NAC was 1.22 cm (range: 0–7.0) for CEDM and 1.13 cm (range: 0–5.1) for CEMRI compared with 1.89 cm (range: 0–12.0) at the final pathology measurement. The sensitivity for identifying residual lesions for CEDM and CEMRI were 62.5% (95% confidence interval [CI]: 40.6–81.2) and 66.7% (95% CI: 44.7–84.4), respectively. The positive predictive values for residual lesions were 93.8% (95% CI: 69.8– 99.8) for CEDM and 88.9% (95% CI: 65.3–98.6) for CEMRI. The mean difference in CEDM was 0.668 cm, with a concordance coefficient of 0.202 and Pearson correlation coefficient of 0.231 (p=0.220).
Conclusion
The diagnostic value of CEDM for detecting the residual tumor extent after NAC was comparable to that of CEMRI.
INTRODUCTION
Neoadjuvant chemotherapy (NAC) is a systemic therapy for patients with breast cancer, especially for large inoperable cases. NAC downsizes the primary tumor, which increases the likelihood of breast-conserving therapy. Evaluating the tumor response to NAC is important for predicting long-term outcomes and future treatment plans. Contrast-enhanced magnetic resonance imaging (CEMRI), ultrasonography (US), and mammography are imaging modalities used to predict chemotherapeutic response.
In addition to the development of digital mammography, Lewin et al. [1] established contrast-enhanced digital mammography (CEDM) in 2003. CEDM traces the uptake of iodine-based contrast agents in breast tissues. Previous studies have shown that CEDM yields valuable information on shape and vascular enhancement, concordant with CEMRI [2]. CEDM displayed better sensitivity of breast cancer detection with high specificity due to higher contrast and better lesion delineation than mammography alone, even in dense breasts [3]. CEMRI shows low specificity for breast cancer detection, high false-positive (FP) rate, leading to overdiagnosis and overtreatment of breast cancer [4].
The preoperative role of CEDM as a possible alternative to CEMRI has gained increasing acceptance. Recently published clinical results have reported that CEDM’s feasibility for detecting primary cancers is similar to that of CEMRI [5]. However, few studies have compared the diagnostic performance and effects of CEDM and CEMRI for evaluating remnant lesions after NAC in breast cancer [6,7].
We aimed to compare the diagnostic performance of CEDM and CEMRI in assessing the extent of remnant lesions in breast cancer patients who received NAC, and to determine the accuracy of CEDM and CEMRI in predicting pathologic complete response (pCR).
METHODS
Patient selection
From November 2017 to October 2018, 340 patients were diagnosed with primary breast cancer at the Kangbuk Samsung Hospital, 63 of which underwent NAC. Patients aged 18 years or older who had histologically confirmed breast cancer with indications for NAC were included. Patients were excluded if they were pregnant or had an anaphylactic reaction to any contrast agent according to the guidelines of the Korean Society of Radiology [8]. Flow chart of the selection process for study participants is shown in Figure 1. This prospective study was approved by the Institutional Review Board (IRB No. KBSMC 2017-09-027). The use of iodinated co ntrast materials has been approved by the Korean Food and Drug Administration. Informed consent was obtained from all the patients, as well as their clinical information.
Flow chart of the selection process for study participants.
CEDM and CEMRI techniques
Mammography was performed before and after NAC using a full-field digital mammography unit (Lorad Selenia, Hologic, Denmark) with standard craniocaudal and mediolateral oblique views. US examinations (Philips Healthcare, Bothell, USA; SuperSonic Imagine, Aix-en-Provence, France) using 5–12 and 5–15 MHz linear transducers were performed before and after NAC.
CEDM and CEMRI were performed before and after NAC, respectively. All CEDM examinations were performed within seven days of CEMRI using a digital mammography device capable of dual-energy CEDM acquisition (Selenia Dimensions; Hologic, Bedford, USA). The CEDM and CEMRI techniques have been previously described in detail [9,10].
Interpretation of CEDM and CEMRI
All US, mammography, and CEMRI reports were interpreted using the American College of Radiology Breast Imaging Reporting and Data System by five breast imaging radiologists with 6–24 years of experience [11]. The median interval between CEDM and CEMRI was 5.1 days (range: 1–29). The CEDM results were reviewed by a radiologist who was blinded to the CEMRI results. The radiologist was blinded to the results of the other studies when reviewing CEDM and CEMRI. During CEMRI interpretation, when there was a discordant result, one radiologist reviewed the CEMRI and reached a consensus. The largest diameter of the contrast-enhancing lesion was correlated and categorized according to the Response Evaluation Criteria in Solid Tumors (RECIST) before and after NAC [12]. In cases with multiple tumors, the largest tumor was used to measure size. The radiologic response method has been previously described in detail [13].
Histopathological analysis
Carcinoma tissue was obtained before NAC by core needle biopsy. Formalin-fixed paraffin-embedded specimens were cut into 3-µm-thick sections and stained with hematoxylin and eosin for microscopic evaluation. Immunohistochemical staining was performed on 3-µm thick tissue microarray block sections. Estrogen receptor and progesterone receptor (PR) statuses were assessed using the Allred scoring method [14]. Human epidermal growth factor receptor-2 (HER-2) overexpression was evaluated using the American Society of Clinical Oncology/College of American Pathologists guideline recommendations. In cases with equivocal HER-2 staining (score 2), silver in situ hybridization (Ventana Medical Systems, Tucson, USA) was performed to determine the HER2 gene status. Tumor response was defined as follows; pCR was defined as the absence of residual invasive and in situ carcinoma in resected breast specimens [15]. Pathologic tumor response was categorized according to RECIST criteria [12]. In non-pCR cases, the largest histopathologic diameters of residual tumors were measured.
Statistical analysis
The sample size cannot be calculated in the absence of an a priori hypothesis. Categorical data were summarized as frequencies and percentages. Tumor sizes measured by CEDM and CEMRI were compared to those measured by pathology (reference standard) within a range of -1 cm to 1 cm. Agreements in histological size between CEDM and CEMRI measurements were evaluated using Bland–Altman plots. The limits of agreement (LOA) estimated the interval within which a proportion of the differences existed between measurements. Lin’s concordance was estimated to assess the agreement between the CEDM, CEMRI, and histopathologic results. Sensitivity (true positive [TP] rate) was defined as the probability by which a non-pCR can be detected by CEDM or CEMRI (TP/[TP+false negative {FN}]). Specificity (true negative [TN] rate) was defined as the probability by which a pCR can be detected by CEDM or CEMRI (TN/[FP+TN]). Positive predictive value (PPV) was defined as the probability by which non-radiologic CR (rCR) predicts non-pCR (TN/[FN+TN]). Negative predictive value (NPV) was defined as the probability by which rCR predicts pCR (TP/[TP+FP]). The results were calculated with the corresponding 95% confidence intervals (CIs). The statistical significance set at p<0.05 (2-tailed) was considered statistically significant. All statistical analyses were performed using PASW Statistics for Windows, Version 18.0 (SPSS Inc., Chicago, USA).
RESULTS
Patient and tumor characteristics
Of the initial 56 patients enrolled, 50 completed the study (3 were lost during follow-up, and three dropped out because of an allergic reaction after injection of contrast medium). Fifty women with breast cancer were included in this analysis (Table 1). Mean [±standard deviation (SD)] age at the time of enrollment was 46.2±8.5 years (range: 31–60). Nine of the 50 patients (18.0%) had a family history of breast cancer. All 50 breast cancers had invasive ductal carcinoma (IDC), not otherwise specified, on initial core needle biopsy. Ten tumors (20.0%) were hormone receptor (HR)+/HER2–, 17 (34.0%) were HR+/HER2+, 8 (16.0%) were HR–/HER2+, and 15 (30.0%) were HR–/HER2–. According to the RECIST criteria, pCR was achieved in ten patients, pathologic partial response (pPR) in 31, pathologic stable disease (pSD) in six, and pathologic progression of disease (pPD) in three patients. pCR was noted in ten cases (20.0%), all of which were IDC; 7 (70.0%) were triple negative and 3 (30.0%) were HER2 positive. Among the three HER2 positive subtypes, two were HR+/HER2+ and one was HR–/HER2+. Radiological CR was observed in 23 cases according to CEDM (46.0%) and 20 cases according to CEMRI (40.0%). Among these ten pCR cases, three showed radiologic CR on both CEDM and CEMRI examinations. Regarding correlations with histopathological results, CEDM defined 45 patients as responders (23 CR+22 PR) and CEMRI defined 44 patients as responders (20 CR+24 PR).
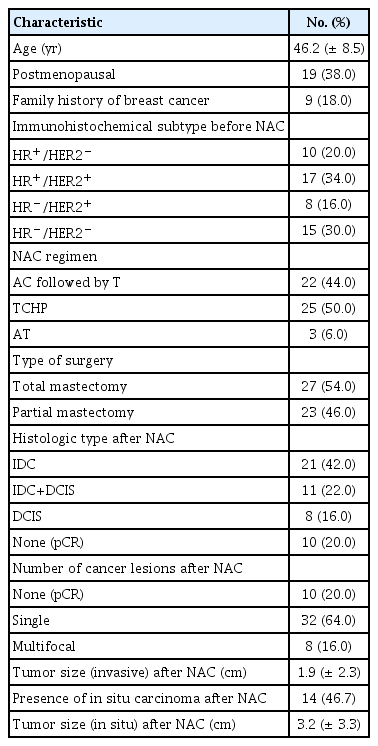
Clinicopathological characteristics of patients (n=50)
Tumor size assessment
The mean tumor size after NAC on histopathology, CEDM, and CEMRI were 1.89 cm (range: 0–12.0), 1.22 cm (range: 0–7.0), and 1.13 cm (range: 0–5.1), respectively. CEDM estimated tumor size to be within 1 cm in 31 patients (62.0%) and underestimated tumor size by more than 1 cm in 12 patients (24.0%). CEMRI estimated the final tumor size to be within 1 cm in 30 patients (60.0%) and underestimated the tumor size by more than 1 cm in 15 patients (30.0%) (Table 2).
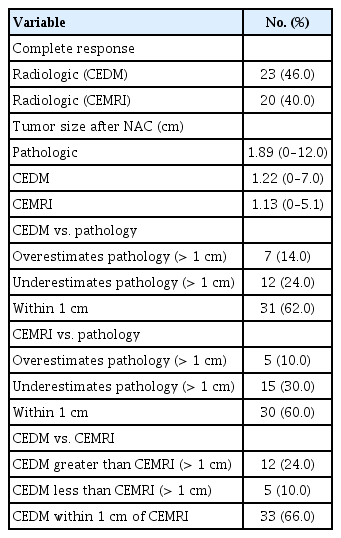
Accuracy of CEDM and CEMRI (n=50)
Diagnostic performance of CEDM and CEMRI
The concordance coefficient between the tumor sizes from CEDM, CEMRI, and histopathologic results was 0.202 (95% CI: -0.109–0.512) for CEDM and 0.243 (95% CI: -0.035–0.520) for CEMRI. The Pearson correlation coefficient was 0.231 for CEDM (p=0.220) and 0.303 for CEMRI (p=0.104). The difference in tumor size between CEDM and residual pathologic lesions was 0.668 cm (SD=2.699). The difference in tumor size between CEMRI and residual pathological lesions was 0.765 cm (SD=2.511). The LOA between pathologic tumor size and CEDM ranged from -4.621 cm to 5.957 cm, while that of pathologic tumor size and CEMRI ranged from -4.156 cm to 5.686 cm (Table 3). The differences between CEDM, CEMRI, and residual pathological tumor size are shown in Figure 2 using Bland–Altman plots. Sensitivity for identifying residual lesions was higher for CEMRI (66.7%, 95% CI: 44.7–84.4) than that for CEDM (62.5%, 95% CI: 40.6–81.2). The specificity of CEDM for identifying residual lesions was 83.3% (95% CI: 65.9–99.6), which was greater than that of CEMRI (66.7%, 95% CI: 22.3–95.7). The PPV for detecting remnant lesions was 93.8% (95% CI: 69.8–99.8) for CEDM and 88.9% (95% CI: 65.3–98.6) for CEMRI, with their respective NPV at 35.7% (95% CI: 12.8–64.9) and 33.3% (95% CI: 9.9–65.1) (Table 4).

Concordance of CEDM and CEMRI with its agreement of tumor size after NAC
Correlation between histopathologic tumor size and contrast-enhanced digital mammography (CEDM) (A) and contrast-enhanced magnetic resonance imaging (CEMRI) (B) described by Bland–Altman plots. We set -1 cm and 1 cm as the lower and upper limit, respectively, for the equivalence test, i.e., of the difference between CEDM and CEMRI measurements. If the result was within this boundary, we confirmed the result to be equivalent to the histopathological result.
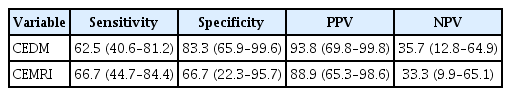
Sensitivity, specificity, PPV, and NPV of CEDM and CEMRI for measuring tumor size after NAC
DISCUSSION
NAC is used to test the response or resistance to chemotherapeutic agents and reduce micrometastatic diseases [16,17]. Evaluating tumor response after NAC is important for determining future treatment plans and predicting long-term outcomes. Currently, CEMRI is the imaging modality for response monitoring [18]. It yields superior outcomes compared to mammography and US for identifying residual disease following NAC [19,20]. However, CEMRI has several limitations, such as long examination time, high cost, low accessibility, and longer interpretation time. In comparison, CEDM is known to have a shorter procedure time, cheaper price, easy interpretability, shorter interpretation time, and no risk of claustrophobia [10,21,22]. In addition, female patients need to schedule their imagining appointments according to menstrual cycle. Some clinicians have suggested conducting CEDM and CEMRI according to menstrual phase; however, some argue that there is no clear pattern in background parenchymal enhancement variation across the menstrual cycle for either CEDM or CEMRI [23]. CEDM also revealed equivalent results for detecting primary and multifocal cancers and estimating the extent of cancers compared to CEMRI [5].
In the present study, CEDM was used to detect and measure remnant tumors after NAC. Although CEDM underestimated the remnant tumor size in some patients, the difference between CEDM and pathologic results was less than 1 cm in 62.0% of cases. Barra et al. [24] reported similar results, with a difference between CEDM and pathologic size within 1 cm in almost 70% of the cases. LOA with residual tumor was lower for CEMRI than for CEDM, which was consistent with the findings of Patel et al. [6].
Regarding diagnostic performance, CEDM demonstrated better specificity, PPV, and NPV than CEMRI, although CEMRI had a better sensitivity than CEDM. Similarly, other studies have reported comparable specificity and PPV for CEDM [6,25]. All women with radiologic CR on CEMRI had negative CEDM results. Our results also showed good correlation and concordance between CEDM and histopathological results after NAC (Figures 3, 4, and Table 3). There are several explanations for the higher specificity of the CEDM. Fallenberg et al. [2] observed that in contrast to the rapid washout in CEMRI, enhancement on CEDM persists for at least 10 min. Thus, slow contrast agent infusion could result in stronger enhancement and hence better visibility compared to CEMRI [26]. Differences in the molecular structure of gadolinium-based and iodine-based contrast medium could explain these results [27]. Other possible explanations include the 10-fold higher spatial resolution of CEDM compared to CEMRI that may better reveal tiny foci of residual enhanced lesions on the tumor bed [28].
Pathologic complete response in a 31-year-old woman with invasive ductal carcinoma in the lower center quadrant of the right breast, correctly assessed using contrast-enhanced digital mammography (CEDM) and contrast-enhanced magnetic resonance imaging (CEMRI) (maximum intensity projection [MIP] image). Before neoadjuvant chemotherapy (NAC), CEDM revealed a rim-enhanced mass accompanied by scattered small enhancing foci (A: mediolateral oblique [MLO] image). CEMRI revealed an enhanced mass (C: MIP view). After NAC, there was no visible enhancement on either CEDM (B: MLO image) or CEMRI (D: MIP view). Complete pathological response was achieved.
Pathologic complete response in a 38-year-old woman with invasive ductal carcinoma in the upper outer quadrant of the right breast, correctly assessed using contrast-enhanced digital mammography (CEDM) but not contrast-enhanced magnetic resonance imaging (CEMRI). Before neoadjuvant chemotherapy (NAC), CEDM revealed an irregular heterogeneous enhanced area (A: mediolateral oblique [MLO] image). CEMRI revealed an enhancing lesion with a multicentric, conglomerate, irregular pattern accompanied by tiny daughter nodules (C: maximum intensity projection [MIP] view). After NAC, there was no visible enhancement of CEDM (B: MLO image). There is a non-mass enhancement area (arrows) at the outer peripheral aspect of the previously noted main mass on CEMRI (D: MIP view). Complete pathological response was achieved.
CEDM and CEMRI both underestimated the extent of remnant cancers (mean tumor sizes from CEDM, CEMRI, and pathology were 1.22 cm, 1.13 cm, and 1.89 cm, respectively). Iotti et al. [27] also reported an underestimation of tumor size by CEDM and CEMRI after NAC. Wu et al. [29] explained this discrepancy as an anti-angiogenic effect of chemotherapeutic agents used in CEDM and CEMRI, such as taxanes and anthracyclines. This anti-vascular effect, which lacks a surrounding inflammatory response, decreases the enhancement of tumor tissue and thus can result in tumor underestimation [20].
The limitations of the present study are associated with several factors. First, we enrolled only a small number of patients. This was possibly because the patients lacked familiarity with CEDM since it was only recently introduced in South Korea; most refused to undergo additional mammography because of the pain induced by breast compression during the procedure. Second, the ability of both CEDM and CEMRI to detect residual ductal carcinoma in situ (DCIS) or suspicious microcalcifications remains unknown. CEDM and CEMRI detect occult breast cancer using the mechanism of tumor angiogenesis [30]; however, the underlying mechanism of tumor angiogenesis depends on the breast cancer subtype. Neo-angiogenesis is more prominent in IDC and does not always exist in DCIS and lobular carcinomas [31]. In our study, none of the pCR patients showed a residual DCIS component on the residual tumor. The feasibility of using CEDM for DCIS should be evaluated further. Third, we could not differentiate the diagnostic accuracy of CEDM based on the presence or absence of microcalcifications. Fourth, there could be a discordance between the actual tumor size and radiologic tumor size measured using CEDM because of breast compression. Several studies have also demonstrated size underestimation with mammography; however, all results were found to be not statistically significant [32-34]. Finally we could not assess the accuracy of CEDM according to molecular subtype, and further investigations are needed.
Our study has several strengths. First, this is the first CEDM study conducted among patients with breast cancer who received NAC in South Korea. Second, we found that the CEDM is secure and practical. There were no technical failures during the procedure, and only one patient experienced side effects (vomiting) during the CEDM examinations. Finally, as this was a prospective study, there was no inherent bias.
In conclusion, CEDM showed diagnostic results comparable to CEMRI in demonstrating residual cancers and estimating the residual tumor extent after NAC. CEDM can be as effective as CEMRI for evaluating patients with NAC.
Notes
The authors declare that they have no competing interests.
Acknowledgements
The authors express special gratitude to mammography specialist technician Yeon-Sun Kim.