유방 관상피내암에서 초음파와 MRI의 종양 크기 예측 정확도 비교
Comparative Accuracy of Preoperative Tumor Size Assessment on Ultrasonography and Magnetic Resonance Imaging in Ductal Carcinoma In Situ
Article information
Trans Abstract
Purpose
The purpose of this study was to compare the accuracy of preoperative breast tumor size measured by ultrasonography (US) and magnetic resonance imaging (MRI) in patients with ductal carcinoma in situ (DCIS).
Methods
Medical records of 74 patients postoperatively diagnosed with DCIS were retrospectively analyzed. Tumor size measurements obtained using the two imaging modalities were compared for accuracy with those obtained during the final pathologic examination. Patients with only microcalcification on imaging were excluded.
Results
For all patients, Lin’s concordance correlation coefficient (CCC) of MRI was 0.725, which was more accurate than 0.670 of US. In subgroup analysis, CCC of US was 0.757, more accurate than 0.697 of MRI in premenopausal DCIS patients. Background parenchymal enhancement (BPE) was the only risk factor deteriorating the accuracy of US and MRI examinations. Moderate and marked BPE was associated with the inaccurate tumor size estimations in both US and MRI (odds ratio [OR]:2.23, 95% confidence interval [CI]=1.12−3.52, p=0.001 in US, OR:8.16, 95% CI=1.17−15.2, p=0.031 in MRI).
Conclusion
MRI was more accurate for measuring tumor size in patients with DCIS. Moderate and marked BPE was a risk factor that prevented accurate measurement of preoperative tumor size. In premenopausal patients, US would help measure tumor size accurately.
서 론
유방의관상피내암(ductal carcinoma in situ, DCIS)은유방의상피세포가 악성화되었지만 아직 정상적인 유관에 한정되어 있는 경우를 지칭하며[1], 최근 30년 동안 빠르게 증가하고 있다[2]. 관상피내암의 빠른 증가는 전체 유방암의 증가와 공유하는 원인이 많지만, 검진의 확대로 인한 증가가 가장 주요하다[3]. 서구에서는 최근 이러한 성장세가 둔화되고 있으나 아시아 국가에서는 여전히 가파르게 관상피내암의 유병률이 증가하고 있다[2,4]. 국내에서 침윤성 유방암의 연령 표준화 발생률(age standardized incidence rate)은 2000년 24.3%에서 2017년 63.0%로 2.6배 증가한데 비해, 관상피내암은 같은 기간 동안 1.6%에서 12.3%으로 7.7배 증가하였다[4].
수술적 치료 방법의 선택에 있어 광범위한 관상피내암 환자는 여전히 유방전절제술(total mastectomy)이 필요하지만, 최근에는 관상피내암으로 진단받은 환자의 60% 이상이 유방보존술(breast conserving surgery)을 시행 받는다[5]. 유방보존술에서 가장 중요하게 고려해야 할 사항은 재발의 가장 큰 위험 인자인 절제연의 암세포 음성을 확보하는 종양학적 안정성이지만[6], 수술 후 유방 형태를 고려하는 미용학적 측면도 중요하게 고려해야 할 요소이다.
간, 폐 등과 같은 고형 장기에서는 절제 후 잔존 조직의 조직 양에 따라 장기 부전의 위험성에 대한 염려로 수술 전 제거 부위에 대한 정밀한 평가를 한다. 반면 유방은 생체 유지에 중요한 역할을 하는 장기가 아니기 때문에 절제연에 암세포를 남기지 않기 위해 수술 시 과도하게 제거하는 경우가 있다. 더욱이 출혈, 문합부 누출 등과 같은 중대한 합병증이 비교적 적은 것도 수술 중 필요 이상의 조직을 제거하는 이유 중 하나이다.
현대 유방암 치료에서 종양성형술(oncoplastic surgery)과 같은 미용적 측면에 대한 관심과 중요성은 점점 커지고 있으며, 이는 관상피내암과 같은 초기 유방암에서는 종양학적 안전성과 함께 매우 중요하게 고려되는 사항이다. 수술 후 유방 형태에 대한 관심은 젊은 연령에서 더 많을 수밖에 없는데, 한국을 비롯한 아시아 국가에서 젊은 여성 유방암의 비중이 서구에 비해 높은 것을 고려할 때, 수술 전 종양 크기를 정확히 예측하여 제거할 유방 조직의 양을 적절하게 결정하는 것이 종양성형술의 우선적인 과제라 할 수 있다.
수술 전 종양 크기 예측에 대한 기존 연구들은 대부분 침윤성 유방암에 국한되어 있는데, 침윤성 유방암과 관상피내암이 임상 및 영상학적 소견이 다름을 고려할 때, 기존의 연구 결과들을 관상피내암에 일반화하여 적용하기엔 어려움이 있다[7,8]. 또한 기존의 침윤성 유방암을 대상으로 한 연구들에서 초음파와 유방 magnetic resonance imaging (MRI)의 종양 크기 예측 정확도에 대한 명확한 결론이 없이 연구자들마다 다른 결론을 내리고 있다[9-12]. 이에 본 연구는 수술 후 최종 조직 병리에서 관상피내암으로 진단된 환자를 대상으로 수술 전 초음파와 MRI의 크기 예측 정확도를 비교하고자 하였다.
방 법
1. 대상 환자
2018년 1월부터 2020년 12월까지 관상피내암으로 진단되어 수술을 시행 받은 175명을 후향적으로 분석하였다. 연구에 포함된 모든 환자는 수술 전 관상피내암으로 진단되었으며, 수술 전 유방초음파와 유방 MRI 검사를 받았다. 이중 1) 절제 생검 및 진공보조흡인절제술(vacuum assisted breast excision) 후 관상피내암으로 진단된 경우, 2) 종양의 크기를 측정하기 어려운 미세석회화(microcalcification)의 형태로만 관찰된 경우, 3) 수술 후 침윤성 유방암으로 진단된 경우, 4) 수술 전 선행항암치료를 받은 후 관상피내암으로 진단된 경우, 5) 본원에서 유방 초음파와 유방 MRI 검사를 시행하지 않은 경우, 6) 남성유방암은 제외하고 총 74명의 환자를 분석하였다.
본 연구는 Institutional Review Board of Jeonbuk National University Hospital에 의해 승인되었다(IRB No. 2021-10-052).
2. 영상 진단 및 판독
모든 영상 촬영은 두 명의 유방 영상의학과 전문의(EJC and JHB, 각각 12년과 8년 경력)에 의해 판독되었다.
1) 유방초음파
12–16 MHz의 선형 탐촉자를 이용한 3개의 초음파 기계로 초음파 영상들을 얻었다(SuperSonic Imagine, Aix-en-Provence, France; ACUSON S2000, Siemens Medical Solution, Mountain View, USA; EPIQ7, Philips Medical Systems, Bothell, USA). 세 개의 서로 다른 유방 초음파 기계가 유방 초음파 일정에 따라 각 환자에게 무작위로 할당되었다. 암으로 진단된 혹에 대해 2개의 B-mode 대표를 얻고 각각의 이미지에서 장경을 측정하였다. 그리고 그중 가장 긴 장경을 혹의 크기로 기록하였다.
2) 유방 MRI
모든 MRI는 3.0-T system을 이용하여 촬영되었다(MAGNETOM Verio, Siemens Healthcare, Erlangen, Germany; MAGNETOM Skyra, Siemens Healthcare, Erlangen, Germany). MRI 프로토콜은 다음과 같다. 한 개의 축상 또는 시상면 지방억제 빠른 스핀 에코 T2강조 영상 (repetition time msec/echo time msec, 2800 –5300/61–72; f 촬영시야, 20× 20 –34×34 cm/격자크기, 320× 240 –512×358; 절편두께, 1 mm; 간격 없음), 한 개의 조영 증강 전 그리고 다섯 개의 조영 증강 후 축상면 지방억제 빠른 스포일드 경사에코 T1강조 영상(4.3/1.6; flip angle, 6 –10˚; 촬영시야, 34×34 cm; 격자 크기, 448×354; 절편두께, 1 mm; 간격 없음)으로 구성되었다. 다섯 개의 조영 증강 영상은 0.1 mmol/kg gadobutrol (Gadovist; Schering AG, Berlin, Germany)을 20 mL 식염수와 함께 2 mL/sec의 속도로 주입 후 즉시 얻었다. 이후 감산(subtraction) 조영 영상과 최대강도 투사영상(maximum intensity projection)을 재구성하여 얻었다. 혹의 크기는 조영 증강 주입 후 90초에 얻어지는 축상면 조기 조영 증강 이미지에서 장경으로 측정하였다. 배경 실질 조영 증강(background parenchymal enhancement, BPE)도 축상면 조기 조영 증강 이미지에서 평가하였으며, 최소, 경한, 중간, 현저한 조영 증강 정도로 나누어 평가하였다.
3. 임상병리학적 정보
의무기록에 기록된 환자의 성별, 나이, 키, 몸무게, 폐경 유무 등의 자료를 후향적으로 분석하였다. 폐경은 과거 양측 난소 절제술을 받았거나, 1년 이상 생리가 없으며 여포자극호르몬(follicle-stimulating hormone) 수치가 40 IU/L 이상인 경우로 정의하였다. World Health Organization/International Association for the Study of Obesity/International Obesity Task Force obesity guidelines에 따라, 체질량 지수(body mass index, BMI)는 몸무게(kg)를 키(m)의 제곱으로 나눈 값으로 계산하였으며 5개의 등급으로 구분하였다[low (< 18.5 kg/m2), normal (18.5–22.9 kg/m2), overweight (23–24.9 kg/m2), obese (25–29.9 kg/m2), or severely obese (≥ 30 kg/m2)][13]. 본 연구에서는 체질량 지수 23.0을 기준으로 2개의 그룹으로 나누어 분석하였다(< 23.0 vs. ≥ 23.0).
수술 후 제거된 모든 조직은 본원 병리과에서 1명의 병리전문의(WSM, 25년 경력)에 의해 판독되었다. NHSBSP (the National Health Service breast screening programme) quality assurance standards에 따라 종양 크기, 조직학적 유형 등을 분석하였고[14], 에스트로겐 수용체(estrogen receptor, ER), 프로게스테론 수용체 (progesterone receptor, PR), human epidermal growth factor receptor-2 (HER-2)을 면역조직화학염색(immunohistochemistry, IHC)으로 판독하였다. 본 연구에서 ER/PR 양성 (positivity)은 IHC에서 Allred score 3점 이상으로 정의하였다[15].
4. 통계 분석
종양의 크기는 mm로 표기하였으며 소수점 첫 번째 자리에서 반올림하여 표기하였다. 연속 변수는 평균값±표준오차로 표기하였으며, 범주형 변수는 숫자와 백분율로 표기하였다. 최종 병리 조직에서 관찰된 종양 크기와 유방초음파, MRI에서 측정된 종양 크기를 비교하여 일치도를 분석하였으며 Lin’s concordance correlation coefficient (CCC)을 이용하여 일치도를 분석하였다. 진단 정확도를 비교한 기존의 연구들에서와 같이 병리 조직에서 측정된 종양 크기와 유방초음파 및 MRI에서 측정된 크기가 10% 이상 차이가 있을 경우 불일치하는 것으로 간주하였고 10% 이내의 차이가 있는 경우 일치하는 것으로 간주하였다. 범주형 변수 사이 상관관계 분석을 위해 Chi-squared test와 Fisher’s exact test를 이용하여 분석하였다. 범주형 변수들과 불일치의 인과관계를 분석하기 위해 logistic regression test를 이용하여 분석하였고, p< 0.05인 경우 통계적으로 유의한 것으로 정의하였다. 통계 분석을 위해 MedCalc for windows, version 19.8 (MedCalc Software, Mariakerke, Belgium)을 이용하여 분석하였다.
결 과
대상 환자들의 중앙 연령은 54.0세, 평균 연령은 53.3±10.6 (범위: 31–75)였다. 이중 28명(37.8%)의 환자가 폐경 전이였으며 4명(5.4%)만 유방전절제술을 받았다. 63명(85.2%)의 환자가 호르몬 수용체 양성이었으며, 35명(47.3%)의 환자에서 HER2가 3+로 측정되었다. Comedo necrosis는 20명(27.0%)에서관찰되었으며, 12명(16.2%)에서 Van Nuys grade 3로 관찰되었다(Table 1). 수술 후 병리 조직에서 측정된 종양의 평균 크기는 16.4±11.3 mm 이였으며 수술 전 영상학적 검사 상 측정된 종양의 평균 크기는 초음파에서 14.4±9.6 mm, MRI에서 19.8±15.3 mm로 병리 조직에서 측정된 실제 크기에 비해 초음파에서는 작게 측정되었으며, 반대로 MRI에서는 크게 측정되었다(Table 2).

Clinicopathologic features of the 74 patients included in the present study

Mean tumor size measured using breast ultrasonography, breast MRI and final pathology
병리 조직에서 측정된 종양 크기와 초음파의 일치율은 0.670 [95% confidence interval (CI) = 0.529 – 0.775]였으며, MRI와의 일치율은 0.725 (95% CI = 0.614 – 0.808)로 초음파와 비교하였을 때, MRI가 더 정확하였다(Figure 1). 유방암의 임상병리학적 인자에 따른 하위그룹 (subgroup) 분석에서 호르몬 수용체, BMI, Comedo necrosis 등의 변수에서는 모두 MRI가 더 정확했으나 폐경과 관련된 변수에서는 차이가 관찰되었다(Table 3). 폐경 전 여성 유방암 환자에서는 초음파의 일치율이 0.757 (95% CI = 0.536 – 0.881)로 MRI의 0.697 (95% CI = 0.439 – 0.849)보다 높았고(Figure 2), 폐경 후 여성 유방암 환자에서는 MRI의 일치율이 0.771 (95% CI = 0.645 – 0.857)로 초음파의 0.649 (95% CI = 0.441– 0.790) 보다높았다(Figure 3).
In all patients, Lin’s concordance correlation coefficient (CCC) of MRI (B) is 0.725 (95% CI, 0.614−0.808), which is higher than that obtained by ultrasonography (A) (0.670; 95% CI, 0.529−0.775). CI = confidence interval; MRI = magnetic resonance imaging.

Results of concordance correlation coefficient analysis between pathologic tumor size and tumor sizes measured by ultrasonography and magnetic resonance imaging according to clinicopathological features (n=74)
In premenopausal patients, Lin’s concordance correlation coefficient (CCC) of ultrasonography (A) is 0.757 (95% CI, 0.536−0.881), which is higher than that obtained by MRI (B) (0.697; 95% CI, 0.439−0.849). CI = confidence interval; MRI = magnetic resonance imaging.
In postmenopausal patients, Lin’s concordance correlation coefficient (CCC) of MRI (B) is 0.771 (95% CI, 0.645−0.857), which is higher than that obtained by ultrasonography (A) (0.649; 95% CI, 0.441−0.790). CI = confidence interval; MRI = magnetic resonance imaging.
본 연구에서는 최종 병리 조직에서 측정된 종양의 크기와 영상 검사에서 측정된 크기가 10% 이상의 차이가 있을 경우 불일치로 판단하였는데, 불일치에 영향을 준 요소를 다변량 회귀 분석하였을 때, 초음파 및 MRI 모두에서 BPE가 위험요소로 분석되었다. BPE는 minimal, mild, moderate, marked BPE로 구분되는데[14], moderate 이상의 BPE가 관찰되는 환자에서 불일치가 더 많이 관찰되었다 [초음파 Odds ratio (OR):2.23, 95% CI =1.12 –3.52, p = 0.001, MRI OR: 8.16, 95% CI =1.17–15.2, p = 0.031] (Table 4). 그러나 BMI, Comedo necrosis, Van Nuys grade, 호르몬 수용체, HER2 등은 불일치와 관련이 없었다.
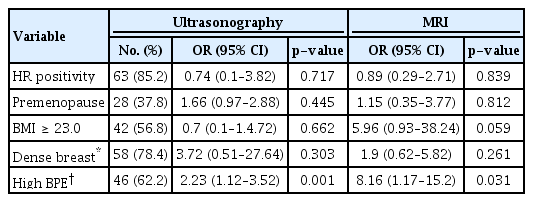
Multivariate logistic regression analysis between clinicopathologic variables and diagnostic inconsistency >10% of pathologic tumor size (n=74)
고 찰
과거부터 유방암 환자의 수술 전 영상학적 검사에 따른 종양 크기 예측에 대한 연구 결과들이 발표되었으나, 초음파와 MRI의 예측 능력이 연구자마다 다르게 발표되어 명확한 결론을 얻기 힘들었다[9-12]. 최근 발표에 따르면 MRI가 초음파와 비교하여 실제 크기보다 종양크기를 더 크게 예측하는 경향이 있으나[16], 대체로 MRI가 초음파보다 종양의 크기를 더 정확히 예측한다고 알려져 있다[9,12,17]. 관상피내암은 갈수로 증가하고 있으나 이러한 추세를 반영하지 못하고 지금까지 관상피내암에서 수술 전 영상학적 검사 상 종양 크기 예측에 대한 연구는 거의 없었는데, 이는 관상피내암의 경우 미세석회와 같이 크기를 측정하기 어려운 형태로 존재하는 경우가 많아 침윤성 유방암에 비해 비정형화된 것이 주된 요인으로 생각한다. 따라서 본 연구에서는 미세석회화의 형태로만 존재하거나, 비종괴 양상 병변(non-mass like lesion) 등 크기 측정이 불가능하거나 가능하더라도 정확성이 떨어지는 관상피내암은 제외하고 종괴의 형태를 보여 크기 측정이 가능한 관상피내암 만을 연구에 포함하여 통계의 정확성을 높였다.
관상피내암을 대상으로 한 기존의 연구 결과와 같이[18], 본 연구에서도 전체 환자를 대상으로 한 크기 예측 정확도는 MRI가 0.725 (95% CI = 0.614 – 0.808)로 초음파의 0.670 (95% CI = 0.529 – 0.775)에 비해 더 높은 것으로 관찰되었다. 기존의 연구와 마찬가지로 본 연구에서도 MRI의 평균 종양크기는 19.8 mm로 실제 평균 종양크기 16.4 mm에 비해 크게 측정되었다. 반면 초음파에서는 14.4 mm로 실제 종양 크기에 비해 작게 측정된 것으로 관찰되었다. 본 연구 결과 주목할 사항은 폐경 전 환자에서는 초음파의 CCC가 0.757 (95% CI = 0.536 – 0.881)로 MRI의 0.697 (95% CI = 0.439 – 0.849)보다 높게 관찰된 점이다. 이러한 결과는 한국에서 폐경 전 유방암을 포함한 젊은 여성의 유방암의 비율이 높은 점을 감안할 때 의미있는 결과라고 할 수 있다[19].
유방 MRI는 조영제 주입 후 주위 조직에 비해 현저하게 더 조영 증강이 되는 지점을 확인함으로써 유방암을 발견하게 되는데, 정상 유방 조직도 조영제 주입 후 조영 증강이 되며 이러한 현상을 BPE라고 칭한다[20]. BPE가 뚜렷할수록 종양을 찾거나 종양의 경계를 구분하는데 제약이 많아지는데[21-23], BPE는 폐경 전 여성에서 폐경 후 여성에 비해 더 뚜렷한 것으로 알려져 있다.
본 연구에서 폐경 여부와 유방암의 여러 인자들의 상관 분석에서 BMI, 종양크기, ER, PR, HER2 등의 표지자들은 통계적 의미를 보이는 차이가 없었으나, 유방촬영술상의 유방 치밀도, MRI에서 BPE는 통계적으로 의미 있는 차이가 관찰되었다.
폐경 전 환자에서는 유방촬영술상 extremely dense breast가 39.3%, marked BPE가 28.6%였던 것에 반해 폐경 후 환자에서는 각각 2.2%, 10.9% 밖에 관찰되지 않았다(각각 p< 0.001, p< 0.001) (Supplementary Table 1). 유방촬영술에서 측정된 유방 치밀도는 초음파 및 MRI의 정확도에 영향이 없었으나 BPE는 본 연구에서 불일치에 영향을 준 유일한 위험 요소였다(Table 3). 따라서 폐경 전 젊은 유방 관상피내암 환자에서 수술 전 종양 크기를 예측하여 절제하는 조직의 양을 결정 시, BPE 등급이 높은 환자에서는 초음파의 역할이 중요할 것으로 보인다.
잘 알려진 것처럼 유방 조직은 내분비 환경에 따라 영향을 받는다. 폐경 이후 형태학적 변화에서 가장 뚜렷한 부분은 유선 상피세포들과 주위의 기질 조직들이 퇴화되어 지방 조직으로 대체되는 것이다[20]. 유방의 영상학적 검사들은 유선 조직의 변화에 민감하게 영향을 받는데, 유방촬영술과 유방 MRI가 초음파에 비해 영향을 더 많이 받을 수 있다[21]. 본 연구에 포함된 30세 폐경 전 여성의 수술 전 초음파와 유방 MRI에서 관찰되듯이, marked BPE로 인해 종양이 주위 조직과 경계가 뚜렷하지 않으며 유두까지 종양이 이어진 형태로 보인다(Supplementary Figure 1A). 그러나 초음파에서는 비교적 경계가 구분되어 MRI와 비교하여 실제 종양 크기와 비슷하게 측정되고 있다(초음파 크기: 15.0 mm, MRI 크기: 45.0 mm, 수술 후 조직학적 크기: 12.0 mm) (Supplementary Figure 1B).
본 연구는 단일 기관에서 후향적으로 진행된 연구로 몇 가지 제한점들이 있다. 우선 관상피내암으로 진단되어 수술받은 환자의 상당수가 미세석회화의 형태로만 존재하여 영상학적 검사 상 정확한 크기 측정이 어려워 연구에서 제외되어 대상 환자의 수가 적었다. 또한 폐경 전 여성에서 생리주기 3 –14일째에 유방 MRI를 촬영하는 것이 정상 유방 조직의 조영 증강을 억제하는데 좋으나[22], 모든 환자에서 그 시기에 촬영하지는 못하였다. 폐경 후 여성에서 호르몬 대체요법(hormone replacement therapy)을 받는 경우 BPE가 폐경 전 여성의 형태를 보일 수 있는데[24], 이러한 사항을 고려하지 않은 것도 제한점이라 할 수 있다. 향후 이러한 제한점들을 보완하여 잘 고안된 다기관 연구가 필요할 것으로 생각한다.
본 연구는 유방 관상피내암 환자의 수술 전 종양 크기 예측에서 유방 초음파와 MRI의 크기 예측 능력을 비교하는 연구였으며, 유방 MRI가 초음파에 비해 더 정확하게 크기를 예측하였다. 유방 MRI의 정확한 크기 예측을 저해하는 위험 인자는 유방 MRI의 BPE 등급이었으며 폐경 전 여성에서는 유방 초음파가 MRI와 비교하여 더 정확하게 크기를 예측하였으나 향후 대규모의 환자를 대상으로 한 전향적, 다기관 연구가 필요할 것으로 생각한다.
Supplementary Materials
Grade of breast density in mammography and background parenchymal enhancement in MRI according to menstrual status
Image of a 30-year-old patient with ductal carcinoma in situ in the left breast. (A) In the axial plane early contrast enhancement MRI image, the size of the lesion was measured to be 4.2 cm, and the background parenchymal enhancement was remarkable. (B) The size of the lesion on ultrasonography was measured to be 1.5 cm. The size of the tumor on pathology was measured to be 1.2 cm.
Notes
The authors declare that they have no competing interests.