Predictive Factors for Non-Response to Neoadjuvant Chemotherapy for Breast Cancer
Article information
Abstract
Purpose
Neoadjuvant chemotherapy (NAC) can effectively downstage locally advanced breast cancer; however, in some cases the cancer remains clinically stable and in others, there is disease progression. Although factors predictive of the response to NAC have been established, those for a non-response remain unknown. This study investigated factors predicting a stable or progressive disease course, and the extent of the response, after NAC based on anthracycline and cyclophosphamide (AC), with or without taxane.
Methods
Data were collected retrospectively by reviewing medical records of patients who received NAC for breast cancer using AC, with or without taxane between January 2013 and December 2017. Patients with clinically stable or progressive disease after NAC were compared statistically with those who achieved a partial or complete response.
Results
In total, 297 patients received NAC with AC and 196 patients received AC followed by taxane. Of these, 45 (15.2%) and 64 (32.6%) patients respectively, showed no response (i.e., stable or progressive disease). Factors related to non-response after AC included large pretreatment tumor size, clinical T3 status, and high histologic grade. Factors related to non-response after taxane included clinical T3 status and estrogen receptor or progesterone receptor positivity.
Conclusion
Clinical T3 stage, grade III histological grade, and estrogen or progesterone receptor positivity were predictors of no response to NAC for breast cancer.
INTRODUCTION
Neoadjuvant chemotherapy (NAC) is a standard treatment for locally advanced breast cancer. Its potential clinical benefits include increasing the chance of breast conservation and improving survival in cases that achieve pathologic complete remission (pCR). In addition, NAC can control micrometastasis that may not have been identified on scans. According to the National Surgical Adjuvant Breast and Bowel Project (NSABP) B-18 and B-27 [1], NAC has no advantage over adjuvant chemotherapy for disease-free survival and overall survival, although the pathologic response and tumor subtype influence the prognosis of patients who undergo NAC. While recognizing that an exact definition of pCR for breast cancer has not yet been determined, it has been reported that patients who achieved pCR after NAC showed significantly improved long-term outcomes [2,3]. Various studies have investigated factors that predict pCR, but none have reported factors that can predict non-response or disease progression following NAC.
The aims of this study were to identify predictive factors for a non-response to standard NAC for breast cancer. Although many factors can affect the response to NAC, if patients unlikely to respond to standard NAC can be identified, other treatment options can be considered for these patients.
METHODS
Study population
This retrospective study reviewed clinical, radiological, and histological assessment data for 320 patients treated with NAC for breast cancer at single center between January 2013 and December 2017. We applied the following exclusion criteria: distant metastasis at initial diagnosis (n=5), another NAC regimen (n= 9), bilateral breast cancer (n=3), treated at another institute (n= 4), and another primary cancer within 5 years (n=2). Thus, in total, 297 patients included in the analysis. This study was approved by the Institutional Review Board of Ajou University Hospital (IRB No. 2017-410).
Staging and treatment
Patients underwent physical examination and breast imaging, such as mammography and ultrasonography of the breast and lymph nodes. After confirmation of the breast cancer through core biopsy of the breast lesion and/or fine-needle aspiration biopsy of the axillary lymph nodes, magnetic resonance imaging (MRI) and fluoro-2-deoxyglucose positron emission tomography-computed tomography (FDG PET-CT) were acquired for the staging work-up. Breast cancer staging was determined in accordance with the American Joint Committee on Cancer (AJCC), 7th edition. All patients in this study had clinical stage II or III breast cancer. At our institution, the most common regimen for NAC is four cycles of anthracycline and cyclophosphamide (AC), comprising 60 mg/m2 of doxorubicin (AdriamycinⓇ) and 600 mg/m2 of cyclophosphamide every 3 weeks. In most patients, this was followed by four cycles of taxane (150 mg/m2 of paclitaxel or 75 mg/m2 of docetaxel) every 3 weeks. If the tumor was found to be positive for human epidermal growth factor 2 (HER2), trastuzumab (6 mg/kg of HerceptinⓇ) was added to the taxane regimen. The definitive surgery was performed about 3 to 4 weeks after the final administration of chemotherapy, unless the cancer size increased during NAC, in which case chemotherapy was terminated, and surgery was performed after an evaluation of distant metastasis.
Assessment of tumor response
Breast ultrasound and MRI scans were acquired to assess the clinical response after four cycles of the AC regimen and/or four cycles of the taxane regimen, or during treatment if the mass was observed to be growing. However, there are no established, validated criteria for monitoring the tumor response [4]. Therefore, we measured the tumor and lymph node size on MRI as an assessment of the response and applied the Response Evaluation Criteria in Solid Tumors criteria (version 1.1) [5]. Accordingly, progressive disease was defined as an increase of at least 20% in the sum of the target lesions and an absolute increase of at least 5 mm. We assessed the clinical response after administering the AC regimen in 297 patients, and the clinical response after administering the taxane regimen in 196 patients were compared that obtained after administering the AC regimen.
Statistical analysis
Differences in the characteristics of the tumor and patients were analyzed using Student’s t-tests and chi-square tests. A logistic regression model using the backward elimination method was used in the univariate and multivariate analyses of predictive factors. P<0.05 was considered to indicate statistical significance. The statistical analyses were performed using SPSS 18.0 (SPSS Inc., Chicago, IL, USA).
RESULTS
Data were reviewed for 297 patients who received NAC before definitive surgery, of which 196 (66.0%) were treated with AC followed by taxane and 101 (34.0%) received only AC. The patients who showed a partial or complete response to NAC were grouped together as the response group and compared to a non-response group of patients with a stable or progressive disease course.
Clinical response to anthracycline-based regimen
After or during the AC regimen, 45 (15.2%) patients were observed to have a stable or progressive disease course (the non-response group). Table 1 compares the characteristics of the patients and tumors in the response and non-response groups. Menopausal status did not significantly influence the response to AC. The histologic type of cancer differed significantly between the groups; the non-response group had more other types of breast cancer than the response group (p=0.004). However, the histologic type was not a predictive factor for the response to the AC regimen. There was no difference in clinical T and N stages between the groups, but the non-response group were more likely to have a larger tumor at diagnosis (p=0.001). There were no differences between the groups in terms of estrogen receptor (ER), progesterone receptor (PR), or HER2 status; however, hormonal receptor-positive cancer was a predictor of non-response to anthracycline. After subdivision according to intrinsic subtypes, 21.5% of ER/PR+/HER2- patients, 15.3% of ER/PR+/HER2+ patients, 19.6% of ER/PR-/HER2+ patients, and 13.1% of ER/PR-/HER2- patients showed clinical non-response, with no significant difference between groups (p=0.120; Figure 1A).

Patients and tumors characteristics at diagnosis
(A) Clinical tumor response to anthracycline according to intrinsic subtypes (p=0.120). (B) Clinical tumor response to taxane according to intrinsic subtypes (p=0.006).
ER = estrogen receptor; PR = progesterone receptor; HER2 = human epidermal growth factor receptor 2; PR = partial response; CR = complete response; SD = stable disease; PD = progressive disease.
Clinical response to the taxane-based regimen
After or during the taxane regimen, 64 (32.6%) patients showed non-response. The median age was 46 years for the non-response group and 48 years for the response group. Menopausal status did not significantly influence the likelihood of clinical response. As with the response to anthracycline, the histologic type of cancer differed significantly between the response and non-response groups. However, unlike in response to anthracycline, the clinical T and N stages both significantly influenced the response to taxane (p=0.001 and 0.009, respectively; Table 1). In the intrinsic subtype analysis, 28.0% of ER/PR+/HER2- patients, 37.8% of ER/PR+/HER2+ patients, 20.5% of ER/PR-/HER2+ patients, and 50.0% of ER/PR-/HER2- patients had a clinical non-response. In patients with HER2+ breast cancer, trastuzumab was administered in addition to taxane, so the difference was not statistically comparable (Figure 1B).
Pathologic response after NAC
The final pathologic response to NAC was confirmed after the definitive surgery. However, the final pathological results could not be compared with the AC regimen and taxane because it reflects the effect of the AC regimen and taxane. In an analysis of these pathologic responses according to intrinsic subtypes, 37% of ER/PR+/HER2- patients, 26% of ER/PR+/HER2+ patients, 8% of ER/PR-/HER2+ patients, and 30% of ER/PR-/HER2- patients had a pathological non-response; these differences were statistically significant (p=0.003; Figure 2).
Pathologic response after neoadjuvant chemotherapy (p=0.003). ER = estrogen receptor; PR = progesterone receptor; HER2 = human epidermal growth factor receptor 2; PR = partial response; CR = complete response:, SD = stable disease; PD = progressive disease.
Predictive factors for a non- response to NAC
Table 2 and 3 summarize the univariate and multivariate analyses of potential predictors of a non-response to anthracycline or taxane regimen. Factors associated with non-response after the AC regimen included a large pretreatment size (odds ratio [OR]=2.19; 95% confidence interval [CI], 1.02 to 3.25; p=0.001), clinical T3 status (OR= 6.34; 95% CI, 1.04 to 24.06; p=0.01), and histologic grade III (OR= 2.01; 95% CI, 1.34 to 4.49; p<0.001). Factors associated with non-response after the taxane regimen included clinical T3 status (OR=2.09; 95% CI, 0.55 to 9.87; p=0.04), and ER/PR positivity (p=0.04/0.01, respectively). The clinical response of HER2-positive patients was influenced by the accompanying trastuzumab, so the comparison of HER2 status is not statistically significant.

Predictive factors of non-response of tumor after anthracycline based neoadjuvant chemotherapy
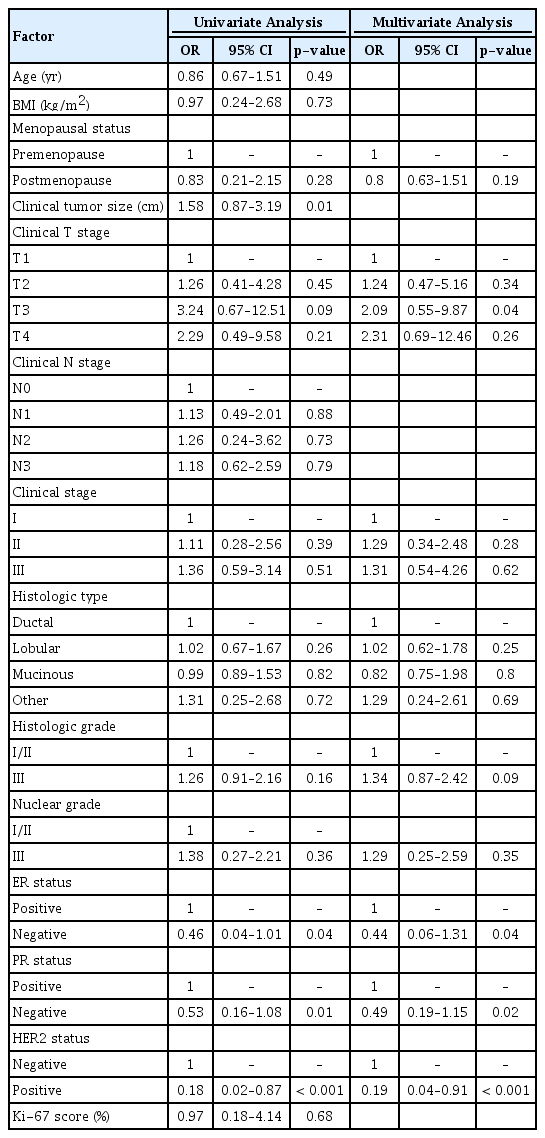
Predictive factors of non-response of tumor after taxane based neoadjuvant chemotherapy
DISCUSSION
NAC is a standard treatment for locally advanced breast cancer, increasing the chance for breast conservation surgery and improving cosmetic results by reducing the amount of tissue that must be removed. However, it is unclear whether achieving pCR predicts long-term outcomes [6]. Although many studies have failed to demonstrate an obvious survival gain for patients who receive NAC, a meta-analysis of 12 randomized controlled trials of NAC reported that individual patients who achieved pCR had more favorable long-term outcomes [7,8]. However, if patients show unexpected results with NAC, this could cause harm, such as leaving them inoperable, or lead to the development of metastatic disease, which has worse eventual survival. Therefore, identifying factors predictive of no response or disease progression during NAC is necessary, in addition to identifying factors that predict pCR.
NSABP B-18 reported an 80% response rate, 36% clinical complete remission, and 9% pCR after a preoperative AC regimen [1]. In a retrospective review of data for 1,928 patients who received NAC for breast cancer, including anthracycline-based and taxane-based regimens, Caudle et al. [9] reported that 6% showed a clinically stable disease course and 3% a progressive disease course during treatment. Of these, 3% showed a progressive disease course and 88.7% a response or stable disease course after the AC-based regimen, and 3% showed a progressive disease course and 73.8% a response or stable disease course after the taxane-based regimen. In our study, 15% showed a non-response after the AC regimen and 33% after AC followed by taxane.
Several trials have reported predictive factors for clinical and pathological responses to NAC, with predictive factors for pCR including young age, lower BMI, hormone receptor-negative tumors, grade 3 tumors, high Ki-67, HER2-positive tumors, and other molecular subgroup-specific predictors [7,10]. However, only a few studies have evaluated the predictive factors for tumor progression during NAC. In the present study, we found that advanced clinical stage, worse histologic grade, and ER/PR positivity were predictive factors of tumor progression during the AC regimen, with or without the taxane regimen; age was not a predictive factor in this study. Loibi et al. [10] reported that ER positivity and increased tumor size were associated with no response. Our study was consistent with this. Conversely, Caudle et al. [9] reported that ER and PR negativity were predictive factors of no response. This result seemed to be associated with aggressive histologic types; when the analysis included aggressive cancer types, such as inflammatory breast cancer connected with mutations in BRCA and metaplastic breast cancer, the results were influenced by the number of aggressive histologic types with regard to ER and PR negativity. To avoid selection bias, we excluded inflammatory breast cancer and metaplastic breast cancer patients from our study.
Recent studies have reported that pCR rates for the AC and taxane regimen were higher for triple negative breast cancer (TNBC) than for other subtypes. It has also been reported that histologic grade, tumor stage, and tumor response ratio were significantly associated with disease-free survival [11]. In one study, pCR was observed in 45% of TNBCs and in 6% of luminal type breast cancers [16]. Consistent with this, the present study found that pCR was observed in 23% of patients with TNBC and in 11% of those with luminal type breast cancer. The MD Anderson Cancer Center evaluated 1,118 patients (23% with TNBC) treated with NAC. The pCR rates were significantly higher for patients with TNBC treated with anthracycline-based regimens. Anthracycline followed by taxane-based regimens were more active, but both progression-free survival and 3-year overall survival were significantly worse for patients with TNBC (hazard ratio [HR] 1.86, 95% CI 1.39 to 2.50, p<0.0001; and HR 2.53, 95% CI 1.77 to 3.57, p<0.0001, respectively) [12,13]. In the present study, the pCR rates for the AC and taxane regimens differed significantly (14% and 12%, respectively).
Many studies have focused on the pCR rates for TNBC; in contrast, our study focused on factors associated with the non-response to NAC. Only 13% of patients with TNBC showed a clinical non-response after the AC regimen; in contrast, when AC was followed by the taxane regimen for patients with TNBC, 50% showed a non-response (p=0.006). Considering the high likelihood of a non-response with the taxane regimen for TNBC, it might be worthwhile to suspend the regimen when imaging shows a non-response. In addition, Liedtke et al. [12] reported that patients with TNBC who did not respond to NAC has worse survival than other patients with other subtypes of breast cancer. The present study clearly showed a higher level of non-response when using the taxane regimen. Further studies are needed to elucidate the combination of clinical factors, novel molecular markers, and genetic factors that predict non-responders to the taxane regimen.
A study reported that the Ki-67 level was a predictive factor for no response to NAC [9]. However, Tan et al. [14] reported that the Ki-67 labeling index better reflected the tumor response to NAC in patients with ER/PR-negative breast cancer. Ki-67 was not included in the present analysis because of a lack of patient data. Ki-67 pathologic data can have characteristics subjective to each pathologist and the results can lack reproducibility. Further studies are needed to standardize and automatize Ki-67 data collection and analysis before its use as a predictive factor for response to NAC can be evaluated.
This study is limited by its retrospective design and because it was conducted in a single institution; therefore, there may be a selection bias. Moreover, since the number of participants was not large, attention should be paid to the statistical analysis, especially the subgroup analysis. It is particularly difficult to interpret the effect of the taxane only regimen in the HER2-positive group because of the simultaneous administration of trastuzumab and taxane.
In conclusion, clinical stage and ER/PR positivity were predictors of non-response to NAC. A combination of predictive factors, including clinical data, novel molecular markers, and genetic factors, are needed to identify patients who are likely not to respond to standard NAC regimens. Based on these predictive factors, early surgery or another neoadjuvant treatment should be considered for these patients.
Notes
The authors declare that they have no competing interests.