INTRODUCTION
Early detection of breast cancer is important for successful treatment and a good prognosis. Early-stage breast cancer is typically asymptomatic—there is no lump or pain. Therefore, breast cancer screening is extremely important.
Mammography is the gold standard for breast cancer screening but has a low sensitivity of 54–77%, depending on the type of mammography [1]. Mammography is also inconvenient and involves exposure to radiation. Therefore, noninvasive screening tests for breast cancer that have high sensitivity and specificity are needed.
Metabolomics is an emerging field that enables identification of the key metabolic pathways in various types of cancers. The metabolism of proliferating cancer cells differs from that of normal differentiated cells [2]. In cancer tissue, hypoxic metabolism is typically upregulated, and lactate is produced; this is known as the Warburg effect [3-5]. The amino acid glutamine provides carbon to enable rapid proliferation of cancer cells and participates in nucleic-acid synthesis [6,7]. Metabolomics studies have typically focused on plasma, serum, urine, tissue, and cerebrospinal fluid specimens.
Urine has long been used for diagnostic purposes, based on its smell, color, and acidity [8]. It is the final product of metabolism and is closely related to clinical phenotype. However, it remains unclear whether the levels of metabolites in blood reflect direct leakage from tumors. If leakage into blood can be a primary reason for metabolic change, the same is true for urine, which reflects one further step in metabolic transformation [9]. Mass spectrometry (MS)-based metabolomics is a useful tool for profiling changes in metabolites in urine [10].
We plan to explore plasma and urinary biomarkers of breast cancer using liquid chromatography-mass spectrometry (LC-MS). Here, we performed LC-MS analysis of urine samples to identify endogenous metabolites that might distinguish patients with breast cancer from healthy controls.
METHODS
Selection of patients and collection of urine samples
This study included 14 patients with breast cancer and 16 healthy controls. The patients with breast cancer were diagnosed and surgically treated at Inje University Busan Paik hospital between 2011 and 2016. Patients who received neoadjuvant chemotherapy were excluded. The healthy controls were individuals with no history of other diseases, including malignancies. The study protocol was approved by the Institutional Review Board of Inje University Busan Paik hospital (IRB No. 17-0191).
Chemicals and reagents
Cholic acid-d5 (internal standard) was purchased from Toronto Research Chemicals (Toronto, Canada). Urease was purchased from Sigma-Aldrich (St. Louis, USA), and high-performance liquid chromatography (HPLC)-grade acetonitrile, methanol, and water were purchased from JT Baker (Philipsburg, USA). Other chemicals were of the highest grade commercially available.
Sample preparation
Urease (15 U) was added to 50-μL urine samples and incubated at 37°C for 15 min to eliminate excess urea. Next, methanol (50 μL) containing 5 μg/mL cholic acid-d5 (internal standard) was added to the urine samples. The mixture was vortexed and centrifuged at 13,200 rpm for 5 min at 4°C. The supernatant (100 μL) was diluted with 100 μL of distilled water in a fresh tube and vortexed; finally, the supernatant was decanted and injected onto the HPLC column.
Chromatographic separation and mass analysis
The samples were analyzed using an Agilent 6530 True High Definition quadrupole time-of-flight mass spectrometer (Agilent, Santa Clara, USA) coupled to a 1200-series HPLC system (Agilent). Separation was performed on a BEH C18 column (100×2.1 mm, 1.7 μm; Waters, Milford, USA) and a ZIC-HILIC column (100×2.1 mm, 3.5 μm; Merck, Darmstadt, Germany). For the BEH C18 column, the mobile phase was 0.1% formic acid in water (A) and 0.1% formic acid in acetonitrile (B) at a flow rate of 0.4 mL/min. The gradient was as follows: 2% mobile phase B for 1 min, an increase to 20% at 3 min and an increase to 90% at 8 min, which was maintained for 6 min; the total run time was 18 min. The temperatures of the column and autosampler were 35°C and 4°C, respectively, and the injection volume was 3 μL. For the ZIC-HILIC column, the mobile phase was 10 mM ammonium acetate in 5/95 acetonitrile/water (A) and 10 mM ammonium acetate in 95/5 in acetonitrile/water (B), at a flow rate of 0.5 mL/min. The gradient was as follows: 99% mobile phase B for 1 min followed by a decrease to 50% at 15 min, which was maintained for 2 min; the total run time was 22 min. The temperatures of the column and autosampler were 40°C and 4°C, respectively, and the injection volume was 5 μL. Electrospray ionization (ESI) was performed in both the positive- and negative ion modes for the BEH column and in the negative-ion mode for the ZIC-HILIC column. The sheath-gas flow rate was set at 11 L/min. The drying-gas flow rate was set at 12 L/min at 350°C. The nebulizer temperature was maintained at 350°C. The capillary voltage was set at 4,000 V in positive ion mode and −4,000 V in negative ion mode, and the fragmentor was set at 110 V. The data were acquired in a scan range from m/z 50 to 1,000 in centroid mode. A reference compound (C18H18O6N3P3F24; [M+H]+ =922.0098 and [M+formate]−=966.0007) was used to correct masses during analysis. An automatic MS/MS analysis was performed for peak identification, and the collision energy was set at 30 eV.
Data processing
MS data were obtained using the following parameters: retention time range, 0.5 to 18 min and 0.5 to 22 min for the BEH and ZIC-HILIC columns, respectively; mass range, m/z 50 to 1,000; and extracted ion chromatogram window, 0.02 Da. The data were converted to mzXML format using conversion software. The data were processed using the XCMS package in R software v. 3.1.0 for peak detection, alignment, and integration. The optimized XCMS parameters were as follows: method=cent wave, signal-to-noise threshold (sn thresh)=10, maximum m/z deviation tolerance (ppm)=30, peak width=(10, 30), bandwidth (bw)=10, and integration method=1 (default). Other parameters were set to the default values. The peaks of isotopes and adducts were annotated using the CAMERA package. The matrix (m/z-retention time-intensity pairs) was generated and exported to a CSV file. Microsoft ExcelTM 2010 was used to remove isotopes and filter the data according to the 80% rule and a noise cut-off value of 10,000. The data were subjected to multivariate statistical analysis using SIMCA-P11.5 software (Umetris AB, Umea, Sweden); all variables were Pareto-Scaled [X - X ¯ / √ SD , X
Statistical analysis
Statistical analysis was performed using Statistical Package for the Social Sciences (SPSS) v. 23.0 software (IBM Corp., Armonk, USA). The nonparametric Kruskal-Wallis and Mann-Whitney U-tests were used to evaluate the significance of differences between the patients with breast cancer and the healthy controls. A p-value of <0.05 was considered indicative of statistical significance. To evaluate the sensitivity and specificity of biomarkers, receiver operating characteristic (ROC) curves were plotted using MedCalc software v. 16.4.3 (Med-Calc Software BVBA, Ostend, Belgium).
RESULTS
Clinicopathological characteristics of the study population
The study population comprised 14 patients with breast cancer and 16 healthy controls. The mean age of the patients with breast cancer was 58.6±10.7 years (range, 42–77 years) and that of the healthy controls was 56.1±2.0 years (range, 52–59 years). Among the 14 patients with breast cancer, two (14.3%), four (28.6%), and eight (57.2%) had a low, intermediate, and high histologic grade, respectively. In terms of tumor size and lymph node (LN) status, eight patients (57.1%) had tumors larger than 2 cm and six patients (42.9%) had LN metastasis. Regarding hormone receptor expression, eight tumors (57.1%) were positive for estrogen receptor (ER) and seven tumors (50.0%) were positive for progesterone receptor (PR). Table 1 shows the clinicopathologic characteristics of the patients with breast cancer.
Urinary metabolite profiles of the patients with breast cancer
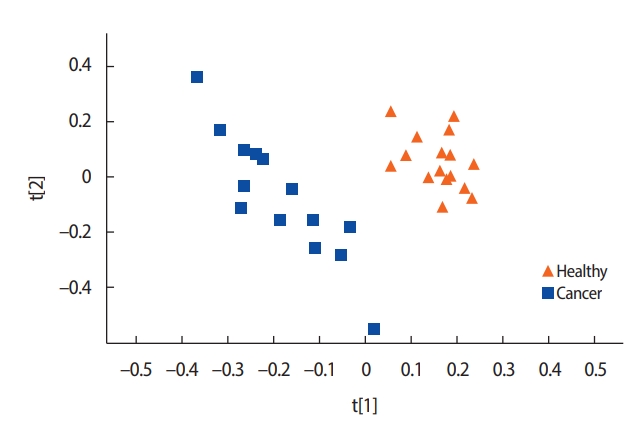
A comparison of the metabolite concentrations in the urine of the healthy controls (n=16) and the patients with breast cancer (n=14) revealed substantial differences. An OPLS-DA with one predictive component and two orthogonal components showed clear separation between the groups. All the healthy controls were scattered on the right side and most of the patients with breast cancer on the left side (Figure 1).
Differences in the concentrations of urinary metabolites
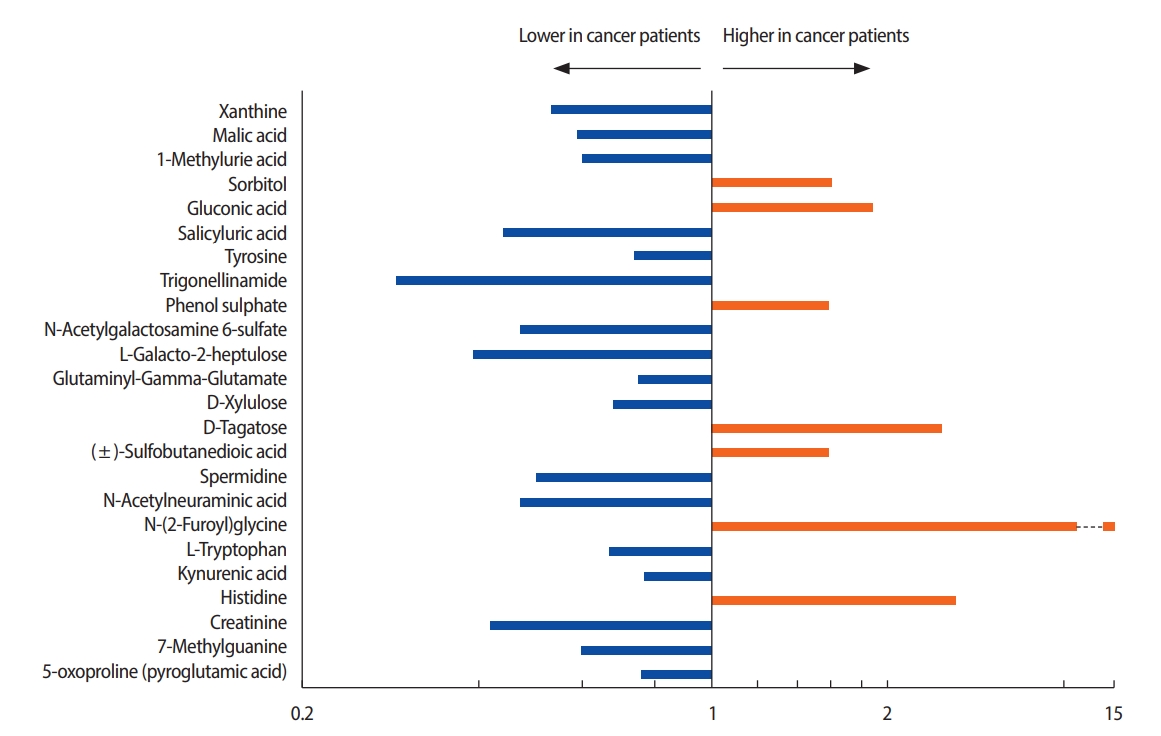
In total, 95 metabolites with concentration differentials were identified. Among these, 24 candidate biomarkers, comprising 10 amino acids, 10 organic compounds, two carbohydrates, a xenobiotic, an energy-related metabolite, and a nucleotide, were subjected to fold-change analysis (Table 2, Figure 2). Student’s t-test revealed that the concentrations of 7 and 17 of these 24 metabolites were significantly higher and lower, respectively, in the patients with breast cancer than in the healthy controls (p<0.05) (Tables 3, 4). For example, the concentration of N-glycine was 13.83 fold higher in the patients with breast cancer than in the healthy controls.
ROC analysis of urinary metabolites
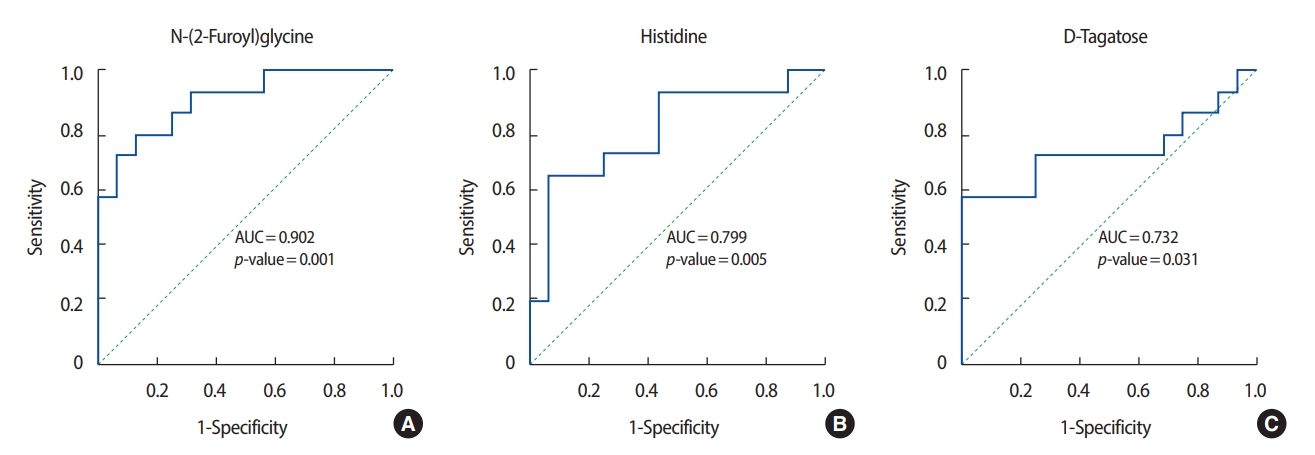
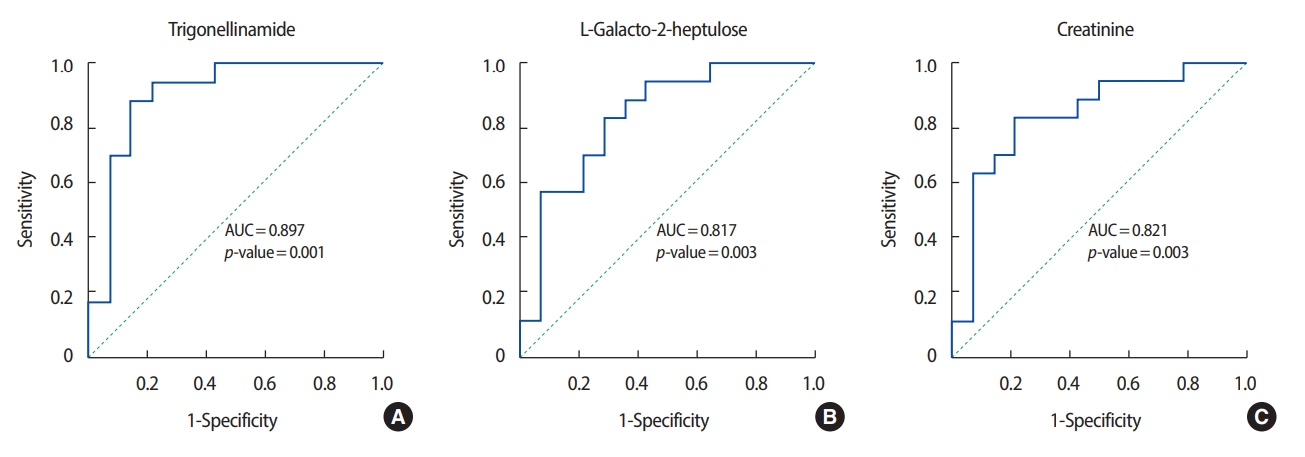
ROC analysis was performed on the three metabolites that exhibited the greatest differences in concentration between the patients with breast cancer and the healthy controls. Among the metabolites with relatively high levels in the patients with breast cancer, N-(2-furoyl) glycine had the highest AUC value (0.902) for discriminating between patients with breast cancer and healthy controls. Figures 3 and 4 show the ROC curves of the three metabolites with the greatest concentration differentials (AUCs of ≥0.7 and ≥0.8, respectively), and their AUCs are listed in Tables 3 and 4.
DISCUSSION
Several metabolomics studies of urine have been reported, typically based on both nuclear magnetic resonance and MS; however, most metabolomics studies of breast cancer have relied on MS [9]. The following urine metabolomics studies have identified biomarkers for breast cancer. Chen et al. [8] were the first to examine the metabolite profiles of the urine of healthy volunteers and patients with breast cancer, and they identified 12 metabolites—including amino acids, organic acids, and nucleosides—as potential biomarkers. Henneges et al. [11] analyzed urine samples from 85 patients with breast cancer and healthy controls by LC-MS. A computational analysis yielded 44 pairwise ratios of metabolite features with a sensitivity of 83.5% and a specificity of 90.6% for best prediction of breast cancer. Nam et al. [12] identified homovanillate, 4 hydroxyphenylacetate, 5 hydroxyindoleacetate, and urea in urine as biomarkers of breast cancer by GC-MS in 50 patients with breast cancer and 50 normal controls. Although these previous studies were similar to our study, we focused on detecting differences in the concentrations of metabolites in urine by LC-MS.
The concentrations of most metabolites in urine are reported to be lower in patients with breast cancer than in normal controls [13], with seven exceptions. Remarkably, the concentration of N-(2-furoyl) glycine, a minor metabolite of fatty acids, was 13-fold higher in the patients with breast cancer than in the healthy controls (AUC, 0.902). The concentration of this metabolite can be affected by food intake and is involved in mitochondrial fatty-acid β-oxidation. Therefore, the increased concentration of N-(2-furoyl) glycine suggests that β-oxidation of fatty acids is enhanced in patients with breast cancer, consistent with reports that lipolysis and lipid oxidation are upregulated in cancer cells [14,15]. Fatty acids are a good source of fuel for cancer cells because mitochondrial fatty-acid oxidation produces more adenosine triphosphate (ATP) than does oxidation of, for instance, glucose or amino acids [16].
In addition to N-(2-furoyl) glycine, the differential concentrations of histidine, xanthine, and pyroglutamic acid in the patients with breast cancer and in the healthy controls were consistent with previous reports. Concentrations of histidine, an essential amino acid in humans and other mammals, were higher in the patients with breast cancer than in the healthy controls, in agreement with a previous report on metabolites in blood [17]. The decreased concentrations of tricarboxylic acid (TCA)-cycle intermediates, such as malic acid, is suggestive of a suppressed TCA cycle in the patients with breast cancer. Similarly, the concentrations of several TCA-cycle intermediates in urine have been reported to be lower in patients with colorectal cancer compared to controls [18].
The decreased xanthine concentration (AUC, 0.938) in the patients with breast cancer is noteworthy. Xanthine is a purine base synthesized from hypoxanthine, which is oxidized to xanthine and subsequently to uric acid by xanthine oxidase with production of reactive oxygen species [19]. Purine nucleotides are synthesized de novo or by salvaging of catabolized purine bases, principally xanthine. The salvage pathway is more efficient than de novo synthesis in terms of ATP consumption [20]. This metabolic change is an important driver of the proliferation of cancer cells because it promotes efficient production of ATP. In this study, the low levels of xanthine in the urine of the patients with breast cancer indicate enhanced consumption of that compound, implying that in breast cancer cells the purine biosynthesis pathway is substituted for the salvage pathway.
Levels of pyroglutamic acid, also known as 5-oxoproline (the cyclic lactam of glutamic acid), were lower in the patients with breast cancer than in the healthy controls. Glutamic acid and glutamine are inter-convertible. Glutamine plays important roles in cancer cells by acting as a nitrogen donor in the synthesis of nucleotides and amino acids. Glutamine also assists in the uptake of essential amino acids and is involved in the activation of TOR kinases [6]. Glutamine is reportedly depleted in the skeletal muscle of cancer patients due to its consumption by cancer cells [21]. Exogenous glutamine is an important source of energy and molecular building blocks for many tumors [22]. Therefore, our findings imply that, in the patients with breast cancer, pyroglutamic acid was consumed to supply the energy required for proliferation of tumor cells. Although further studies of its metabolism are warranted, pyroglutamic acid may be a promising diagnostic biomarker and therapeutic target for breast cancer.
To investigate their performance as biomarkers, six metabolites were subjected to ROC analysis; all showed an AUC of ≥ 0.7. However, this finding must be validated using independent datasets, which may have distinct characteristics. This study was limited by the small sample size. We plan to conduct a comparative analysis of blood and urine specimens with a larger number of subjects.
Even though the advent of metabolomics has been facilitated by improvements in instrument technology, it has some significant limitations. Metabolites are sensitive to environmental impacts. They are affected by environmental factors of the subjects including diet, alcohol, medication and physical activity [23]. In addition, chronic diseases or conditions such as obesity, diabetes and cardiovascular disease, in which metabolic dysregulation plays a key role in pathophysiology and disease progression, are variables in metabolism [24]. Furthermore, some metabolites are labile and are of extremely low abundance in the human body. Protocols for extracting and obtaining the metabolome have been well developed for various biological samples, including tissue, plasma and urine. Although anyone can use these protocols easily, even minor changes in procedure can result in a major impact on the observed metabolome. For example, subtle change of temperature can affect activity of enzyme, distorting concentration of metabolites. Because of this chemical instability, improper handling of the samples may act as biases without producing consistent results [25].
In this study, the patients with breast cancer had a urinary metabolite profile that was distinct from that of the healthy controls. Diagnostic screening based on urine samples is non-invasive, inexpensive, and easy to perform. Measurement of the concentrations of metabolites in urine may enable early detection of breast cancer and so increase the survival rate by facilitating timely application of treatment. We plan to explore biomarkers of breast cancer further by combining the findings from this study with biomarkers in blood identified by LC-MS.