| Home | E-Submission | Sitemap | Contact Us |  
Journal of Breast Disease > Volume 9(1); 2021 > Article
Lee, Park, Kim, Cho, Yang, Lee, Park, Kim, Shin, and Gwak: Characteristics of HER2-Positive Breast Cancer according to HER2 2+/Low or 3+/High Classification by Immunohistochemistry Assay: Study of 205 Cases Treated in a Single Center

Abstract

Purpose

To investigate the characteristics of HER2-positive breast cancer according to HER2 low (2+) or high (3+) classification using immunohistochemistry (IHC).

Methods

Data were collected from 205 HER2-positive breast cancer patients in the final assay, regardless of IHC or in situ hybridization (ISH). We thus classified patients into two groups: HER2 2+/low and HER2 3+/high based on the IHC assay. We subsequently compared the clinical and pathological characteristics between groups.

Results

The median patient age was 49 years in the HER2 2+/low group and 53 years in the HER2 3+/high group. We observed a significantly lower Allred score for estrogen receptor (ER) and progesterone receptor (PR) (0-6) (p<0.001), less lymphatic invasion (LI), (p=0.010), neural invasion (p=0.041), higher Ki-67 (p=0.001), and lower Bcl-2 (p<0.001) in the HER2 3+/high group than in the HER2 2+/low group. Lymph node recurrence was more frequently observed in the HER2 2+/low group than in HER2 3+/high group (p=0.005). Disease-free survival (DFS) was better in the HER2 3+/high group than in the HER2 2+/low group (p=0.028), but there were no significant differences in overall survival between the groups (p=0.233).

Conclusion

The HER2 3+/high group was associated with lower ER and PR expression, less LI, higher Ki-67, and lower Bcl-2 than that in HER2 2+/low group in HER2-positive breast cancer. Furthermore, compared to the HER2 2+/low group, the HER2 3+/high group had an improved DFS.

INTRODUCTION

HER2-positive breast cancer accounts for approximately 20%–30% of all breast cancers [1-4]. HER2 gene amplification in breast cancer is associated with more aggressive clinical progression and poor prognosis [5]. However, with the development of anti-HER2 target therapy in the last 20 years, the prognosis of HER2-positive breast cancer has improved. In particular, in the setting of advanced or metastatic breast cancer, clinical trials have shown that numerous newly developed anti-HER2 target drugs have contributed to the extension of the lifespan of HER2-positive breast cancer patients [6].
Based on routine immunohistochemical (IHC) staining for estrogen receptor (ER), progesterone receptor (PR), Ki-67, and HER2, breast cancers can be classified into four molecular subtypes: luminal A, luminal B, HER2-positive (luminal B or non-luminal), and triple negative [7-9]. Determining the presence of HER2 positivity is very important in the treatment of breast cancer patients. Based on conventional IHC staining, HER2 readings are graded as 0–3 scores and require positive confirmation if read as 3+, but additional tests are recommended as equivocal if read as 2+ [10-12].
Because of this reading system, HER2-positive breast cancer includes both high and low expression of the cell membrane receptor. Some studies have shown that HER2-positive breast cancer may exhibit a different clinical pattern and prognosis due to the presence of non-homogeneous cell receptors [13,14]. The aim of this study was to compare clinical outcomes and prognosis between groups with IHC staining scores of 2+ (low expression) and 3+ (high expression) in HER2-positive breast cancer.

METHODS

We collected the clinical data of 205 cases with HER2-positive breast cancer in the final assay, regardless of their IHC or in situ hybridization (ISH) results. All patients were diagnosed at a single medical institute between September 1st, 2001 and September 1st, 2018. The median follow-up period was 8.1 (range, 3.8–12.4) years. We classified these patients into two groups according to the results of the IHC assay: HER2 2+/low and HER2 3+/high. HER2 2+/low patients were positive for fluorescence in situ hybridization (FISH) or silver-enhanced in situ hybridization (SISH) tests. We analyzed the clinical and pathological variables in the HER2 low and high groups, including age at diagnosis, operation methods in the breast and axilla, TNM stage, histologic grade, lymphatic invasion (LI), neural invasion (NI), vascular invasion (VI), and Bcl-2 and Ki-67 expression. We further compared the disease-free survival (DFS) and overall survival (OS) outcomes between the groups. The DFS rate is defined as the percentage of people who have no symptoms or signs of cancer after primary treatment for breast cancer, while the OS rate is defined as the percentage of people who are still alive for a certain period of time after initial diagnosis.
The study was approved by the Institutional Review Board (IRB No. SGPAIK 2020-09-001) and was performed in compliance with the ethical standards of the Declaration of Helsinki. Informed consent was waived due to the retrospective nature of the study.

IHC staining for ER, PR, Bcl-2, and Ki-67

Mouse monoclonal antibodies specific for ER (Leica Microsystems Inc., Newcastle Upon Tyne, UK) and PR (Leica Microsystems Inc., Newcastle Upon Tyne, UK) were diluted at 1:80 in a solution of 20% normal goat serum in Tris-buffered saline and used as primary antibodies for ER and PR IHC staining, respectively. Subsequently, peroxidase-conjugated goat anti-mouse immunoglobulin was used as the secondary antibody. After treatment with the chromogen 3,3-diaminobenzidine tetrahydrochloride (DAB), ER and PR staining intensities were scored as 0, 1+, 2+, and 3+, together with a description of the percentage related to the proportion of stained nuclei in 10 high-power fields. The intensity scores and percentages were then converted into Allred scores, whee a score of 0 was defined as negative, 1-6 as weakly positive, and 7-8 as strongly positive
IHC for Bcl-2 and Ki-67 was performed using the avidin-biotin peroxidase complex method, with the Vectastain ABC Elite kit (Vector Laboratories, Burlingame, USA) and aminoethylcarbazole as the chromogen. Bcl-2 overexpression was defined as a Bcl-2 staining intensity of >33%. A Ki-67 cutoff of 20% was used to identify the low proliferation group, which was considered optimal when stratifying high-risk patients with luminal breast cancer [15].

IHC staining for HER2/neu

Primary antibody binding was detected using the Dako Quick-Staining, Labeled Streptavidin-Biotin System (Dako, Carpinteria, USA), followed by the secondary DAB chromogen. Each slide was scored in a blinded manner by two pathologists, according to the manufacturer’s recommended criteria. Intensity scores of 0 or 1+ were considered negative for HER2/neu, while a score of 3+ was considered positive. A score of 2+ was considered equivocal, and in such cases the tissue was subjected to FISH or SISH [15,16].

FISH or SISH for HER2 gene amplification

Two-color FISH was conducted on 3.5 μm consecutive sections of tissue microarray paraffin blocks using 20 μL of LSI HER2/CEP17 probes (Vysis Inc., Downers Grove, USA). An increase of at least a 2-fold in HER2 signals over the CEP 17 signals using the LSI HER2 probe in the tumor cell was considered as the criterion for gene amplification [15].
HER2 SISH was performed using a Ventana Benchmark automated instrument (Ventana Medical Systems Inc., Tucson, USA) according to the manufacturer’s protocols for the INFORM HER2 DNA and chromosome 17 probes. HER2 gene amplification was evaluated in a blinded manner according to the guidelines of the American Society of Clinical Oncology/College of American Pathologists [16].

Statistical methods

The chi-square test was used to analyze the clinicopathological factors affecting the prognosis of patients in the HER2 2+/low and HER2 3+/high groups. Differences in DFS and OS between the two groups were analyzed using the Kaplan-Meier method, and a Cox multivariate regression model was used for multivariate analysis. SPSS Statistics version 21 (IBM Corp., Armonk, USA) and MedCalc Statistical Software version 17.6 (MedCalc Software, Ostend, Belgium) were used for statistical analysis. A p-value<0.050 was considered statistically significant.

RESULTS

The demographic and clinical characteristics of the 34 HER2 2+/low and 171 HER2 3+/high patients are shown in Table 1. All 34 HER2 2+/low patients were positive for the FISH/SISH tests. The median age of the patients was 49 years (range, 30–76) in the HER2 2+/low group and 53 (range, 24–80) years in the HER2 3+/high group. The distribution of patients under 50 years old was more higher in the HER2 2+/low group (p=0.034). The results of HER2 expression analysis according to stage showed that in the HER2 2+/low group, 4 patients (11.8%) were stage 1, 23 patients (67.6%) were the stage 2, and 7 patients (20.6%) were the stage 3. However, in the HER2 3+/high group, 68 patients (39.8%) were stage 1, 68 patients (39.8%) were stage 2 and 35 patients (20.5%) were stage 3. The ratio of stage 1 was significantly higher in the HER2 3+/high group (p=0.003). However, there were no significant differences in operation methods or adjuvant therapy including chemotherapy, radiotherapy, endocrine therapy, and HER2-targeted therapy between the two groups. When we analyzed the demographic and clinical characteristics according to stage, the ratio of breast preservation surgery was significantly higher in stage 2 breast surgery (Table 1).
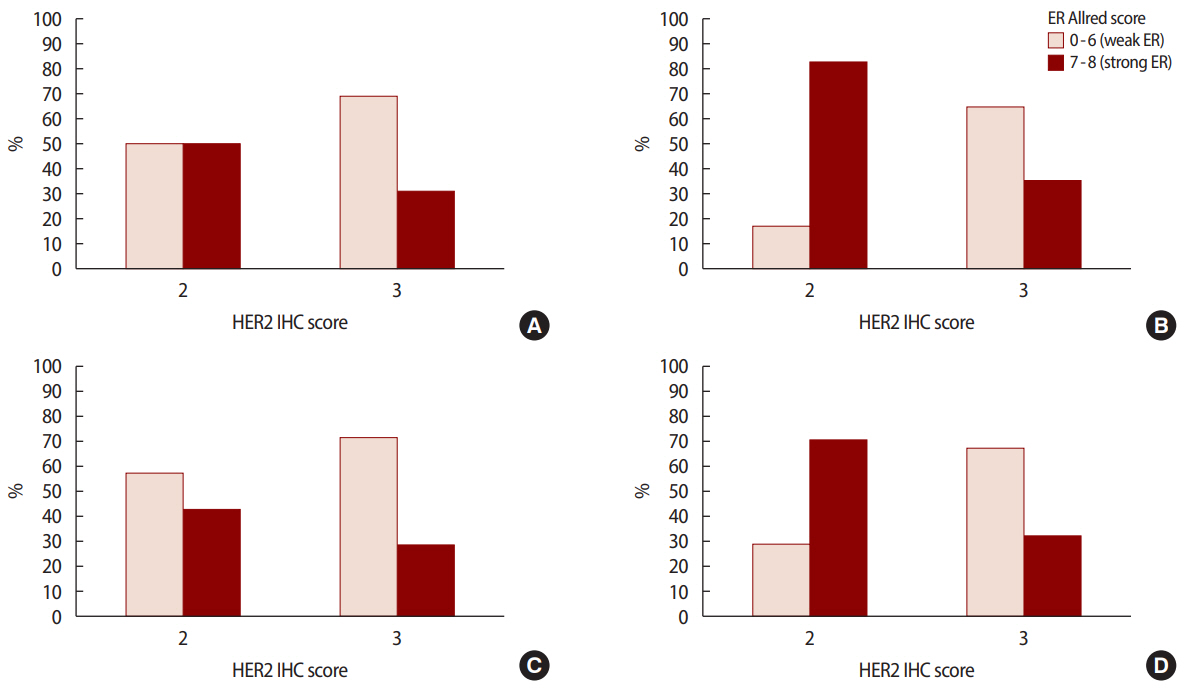
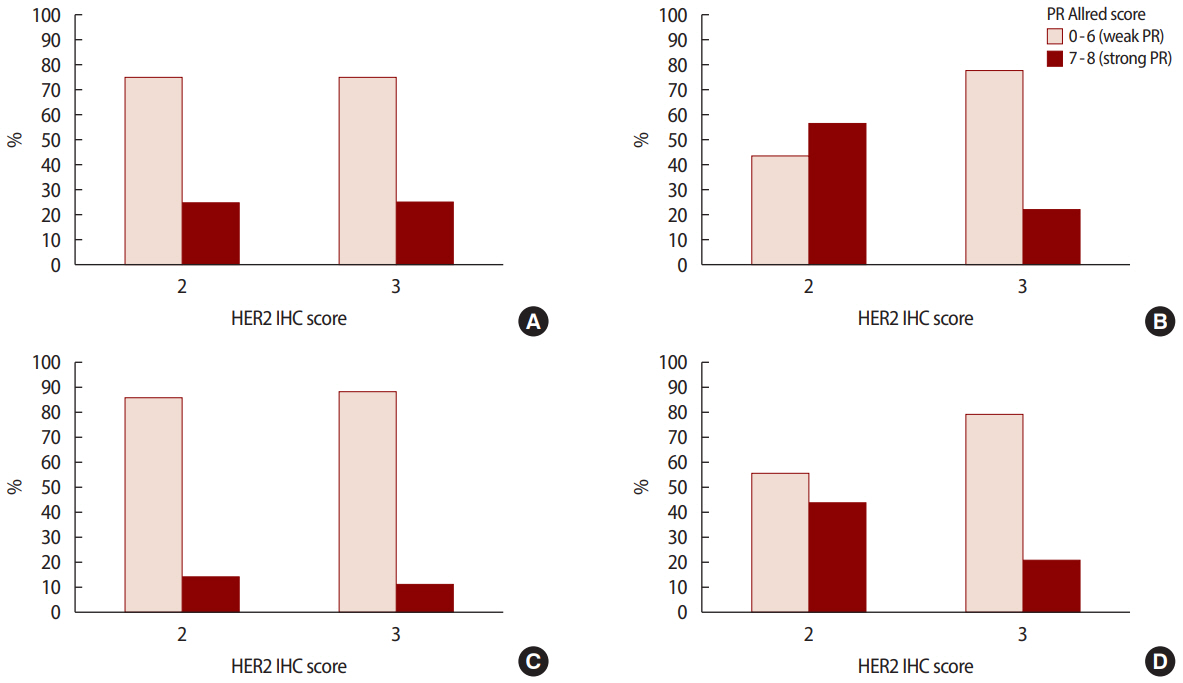
The pathological characteristics of the HER2 2+/low group were associated with strong hormone receptor expression, such as a higher ER Allred score (p<0.001) and a higher PR Allred score (p<0.001), frequent LI (p=0.010), and NI (p=0.041) compared to the HER2 3+/high group. However, the HER2 3+/high group had a high percentage of over 20% when the cutoff of Ki-67 was 20% (p=0.001) and a low percentage of over 30% when the cutoff of Bcl-2 was 30% (p<0.001). However, no significant intergroup differences were observed in regard to vascular invasion. Analysis of pathological factors showed that the expressions of ER (p<0.001) and PR (p<0.001) were significantly higher in the stage 2 and 3 in HER2 2+/low group (Figures 1, 2) (Table 2).
The analysis of relapsed organs showed no significant difference in tumor occurrence in the breast, liver, lung bone, and brain between the two groups. However, the occurrence of lymph node metastasis was significantly higher in the HER2 low group than in the HER2 high group (26.5% vs. 9.4%, p=0.005). Recurrence analysis according to the stage showed that the local incidence was high in stage 1 (p=0.032) and lung metastasis was high in stage 2 (p=0.044) of the HER2 2+/low group, but the difference in lymph node metastasis was not statistically significant (Table 3).

DFS and OS outcomes of HER2 2+/low and HER2 3+/high patients

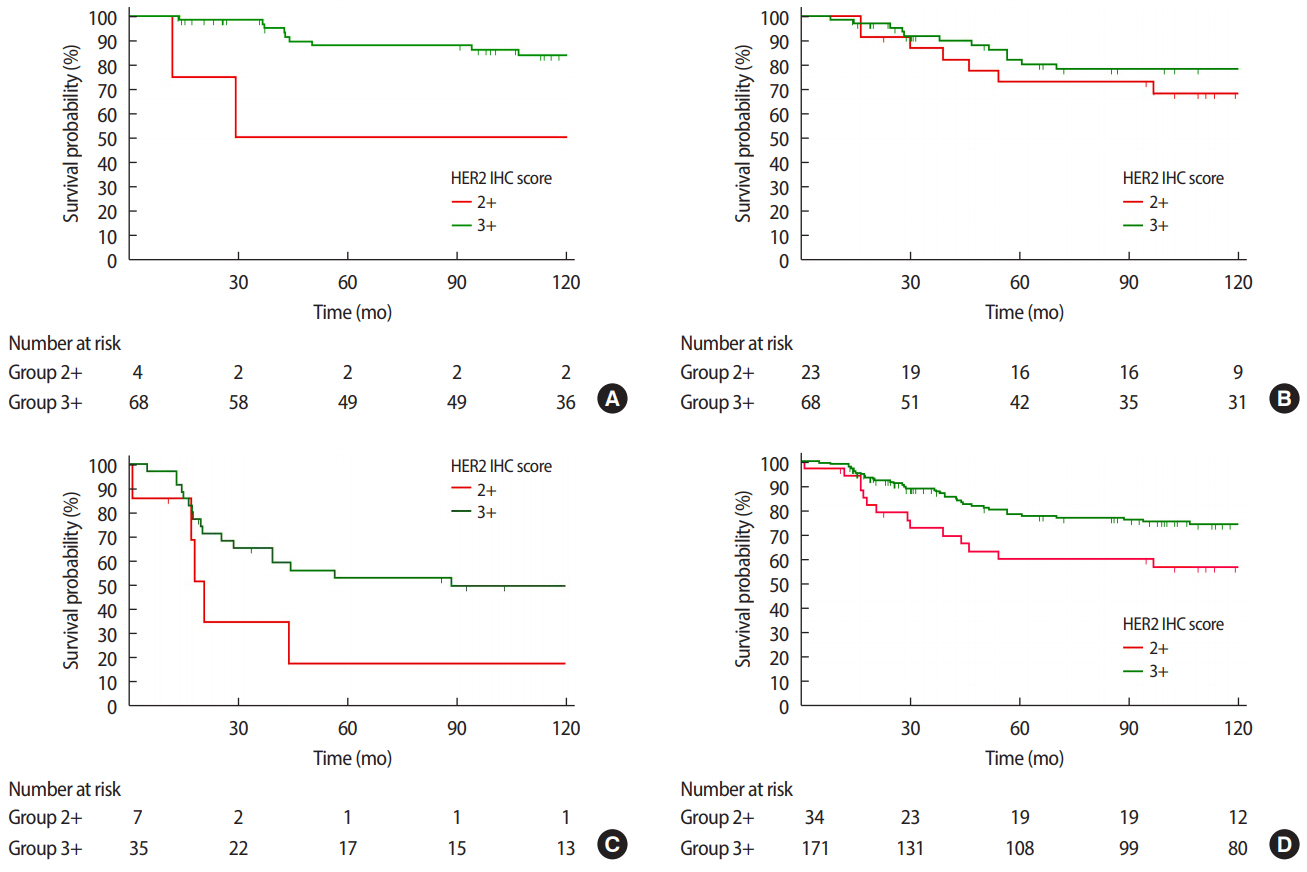
When looking at all stages combined, the HER2 3+/high group was associated with a significantly better DFS rate than the HER2 2+/low group, as the former was associated with an 11.5% lower recurrence rate at the median follow-up of 8.10±4.3 years (p=0.028). However, when we analyzed the survival of each group according to the stage, we observed a statistically significant difference in DFS between HER2 2+/low and HER2 3+/high only at stage 1 (p=0.019) (Figure 3).
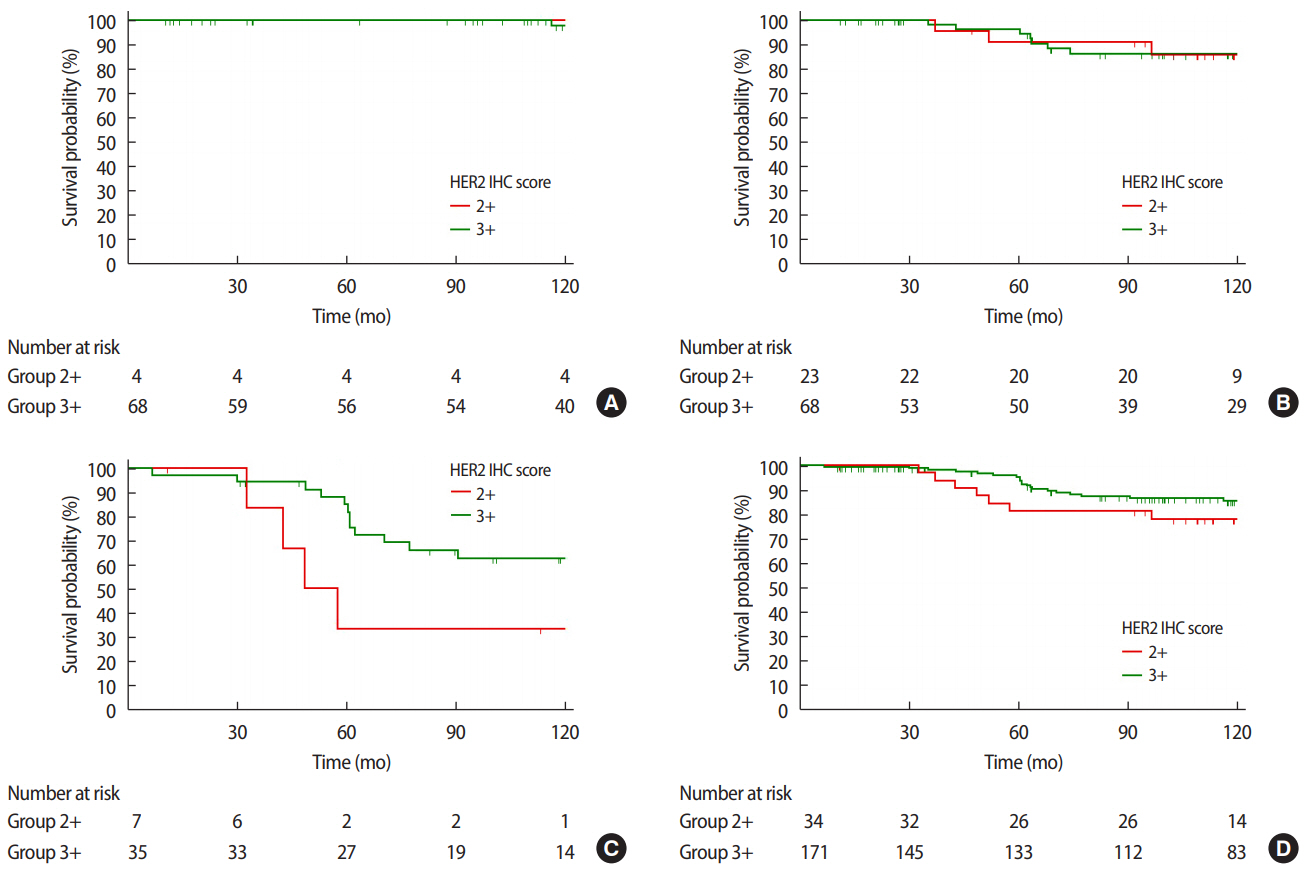
In all stages combined, no significant intergroup differences were observed with regard to OS (p=0.233). However, when we analyzed the survival of each group according to each stage, the HER2 3+/high group was associated with a significantly better OS than the HER2 2+/low group at stage 3 (p=0.049) (Figure 4).

DISCUSSION

In recent years, the prognosis of HER2-positive breast cancer has improved greatly due to the development of HER2-targeted therapeutic drugs. The issue of intratumoral and intertumoral heterogeneity of HER2-positive breast carcinoma has been consistently well documented in terms of resistance to treatment and poor prognosis since the introduction of HER2-targeted therapy [13,17-19]. Breast cancer HER2 IHC results show a complete and intense circumferential membrane staining in 10%-100% of tumor cells, with a HER2 IHC score of 2+ indicating an incomplete and/or weak circumferential staining or complete and intense circumferential membrane staining in only >10% of the tumor cells [11].
Previous studies have shown that the HER2 genetic heterogeneity increases to 34% in breast cancer and is more common in cases with HER2 equivocal status on ISH and/or IHC [17,18]. The heterogeneity of the HER2 gene includes cases with protein overexpression without gene amplification, amplification without protein overexpression, or marked intratumoral heterogeneity. The ASCO/CAP guidelines recommend reporting separate areas if heterogeneous amplification of HER2 expression in breast cancer tissues is observed [20]. This approach is intended to maximize the clinical benefits of HER2-targeted therapies, despite the fact that the clinical implications of heterogeneity of HER2 expression in breast tumors remain unknown [21].
In this study, the HER2 2+/low group showed several differences in characteristics compared to the HER2 high group. First, the proportion of stage 1 in the HER2 2+/low group was 11.8%, which was significantly lower than the 39.8% in the HER2 3+/high group. The difference in stage at the time of diagnosis was presumed to result in worsening of the poor prognosis due to resistance to HER2-targeted therapy in the HER2 2+/low group. Several researchers have reported that high levels of HER2 protein increase the survival rate of breast cancer patients treated with HER2-targeted therapy [13]. Our research also provided supporting evidence for the preceding research. In comparison with the survival results of this study, the HER2 2+/low group showed worse DFS than the HER2 3+/high group. The reason for these survival results is that a decline in HER2 protein expression affects the treatment results, as reported in previous studies, while the high stage at diagnosis and frequent lymph node involvement also played a role in the poor prognosis of the HER2 2+/low group.
Second, our study showed that the level of ER expression in the HER2 3+/high group was lower than that in the HER2 2+/low group. The presence of ER and HER2 expression is a biological indicator that determines two major therapeutic options for breast cancer. Preclinical and clinical evidence showing bidirectional crosstalk between the ER and HER2 pathways has been previously published. This is considered to be one of the important mechanisms associated with drug resistance in endocrine therapy [22,23]. However, the mechanism underlying resistance to HER2-targeted therapy is known to be different from that underlying endocrine therapy. Resistance to HER2-targeted therapy mainly involves the masking of antibody-binding epitopes, which is a form of truncation with kinase activity, an extracellular domain neutralizing HER2 antibodies, or can involve a change in the target itself with mutations in the tyrosine kinase domain [24,25]. The inverse association between ER/PR and HER2 expression has been studied. Many studies have shown that the high level of ER expression in the low HER2 expression group is related to therapeutic resistance [26,27].
Third, when we analyzed the correlation between HER2 expression and Ki-67, a marker of proliferation and mitotic activity, a high Ki-67 score correlated with the high HER2 group. According to the St. Gallen 2013 conclusions, a standardized cutoff for Ki-67 has so far not been established and that laboratory-specific values should be used, but the majority of the panel voted that the 20% threshold clearly represented a high Ki-67 state [27]. Kurbel et al. [28] studied the unexpected differences in Ki-67 values among the HER2-and ER/PR-defined subgroups. Their study showed that innate mitotic activity of ER/PR-positive breast cancer is generally low, and HER2 overexpression can act as a factor to promote proliferation in some tumors with moderate mitotic activity. In PR-negative breast cancer, the connection between HER2 status and Ki-67 value is weakened or lost. However, ER-negative breast cancer has an essentially high mitotic activity, especially in HER2-negative breast cancer, showing only somewhat reduced mitotic activity in HER2-positive breast cancer.
This study has several limitations, primarily including its retrospective design and small study population, which was sourced from a small patient pool at a single institute. Consequently, this study may have been weak in terms of statistical power. The number of patients who received HER2-targeted therapy is small; this is because HER2-targeted therapy has only been covered by insurance since 2006 in South Korea, In conclusion, the HER2 high group was more related to lower ER and PR expression, less LI, higher Ki67 expression, and lower Bcl-2 expression than the HER2 low group among HER2-positive breast cancers. The HER2 high group had better prognosis than the HER2 low group in terms of DFS.

CONFLICT OF INTEREST

The authors declare that they have no competing interests.

Figure 1.
ER Allred score 0-6 (weak ER) vs. 7-8 (strong ER) according to HER2 IHC score at (A) stage I (p=0.429), (B) stage II (p<0.001), (C) stage III (p=0.461), and (D) all stages combined (p<0.001). ER=estrogen receptor; HER2=human epidermal growth factor receptor 2; IHC=immunohistochemistry.
jbd-9-1-1f1.jpg
Figure 2.
PR Allred score 0-6 (weak ER) vs. 7-8 (strong ER) according to HER2 IHC score at (A) stage I (p=1.000), (B) stage II (p=0.002), (C) stage III (p=0.833), and (D) all stages combined (p=0.005). PR=progesterone receptor; ER=estrogen receptor; HER2=human epidermal growth factor receptor 2; IHC=immunohistochemistry.
jbd-9-1-1f2.jpg
Figure 3.
Disease free survival (DFS) curves according to HER2 IHC score at (A) stage I (p=0.019), (B) stage II (p=0.353), (C) stage III (p=0.077), and (D) all stages combined (p=0.028). HER2=human epidermal growth factor receptor 2; IHC=immunohistochemistry.
jbd-9-1-1f3.jpg
Figure 4.
Overall survival (OS) curves according to HER2 IHC score at (A) stage I (p=0.760), (B) stage II (p=0.995), (C) stage III (p=0.049), and (D) all stages combined (p=0.233). HER2=human epidermal growth factor receptor 2; IHC=immunohistochemistry.
jbd-9-1-1f4.jpg
Table 1.
Demographic and clinical characteristics of HER2-positive breast cancer according to low and high level of HER2 receptor expression by IHC
(A) All stages combined
Characteristic HER2 -positive breast cancer by IHC
HER2 2+/low (n=34) HER2 3+/high (n=171) p-value
No. (%) No. (%)
Median age (yr) 49 53
Age (yr) ≤ 50 20 (58.8) 67 (39.2) 0.034
> 50 14 (41.2) 104 (60.8)
Stage I 4 (11.8) 68 (39.8) 0.003
II 23 (67.6) 68 (39.8)
III 7 (20.6) 35 (20.5)
Breast operation type BCS 23 (67.6) 98 (57.3) 0.264
Mastectomy 11 (32.4) 73 (42.7)
Axilla operation type SLNB 10 (29.4) 70 (40.9) 0.345
ALND 24 (70.6) 99 (57.9)
Not done 0 2 (1.2)
Chemotherapy Not done 5 (14.7) 31 (18.1) 0.632
Done 29 (85.3) 140 (81.9)
Radiotherapy Not done 12 (35.3) 67 (39.2) 0.653
Done 22 (64.7) 104 (60.8)
Endocrine therapy Not done 7 (20.6) 44 (25.7) 0.527
Done 27 (79.4) 127 (74.3)
HER2-targeted therapy Not done 21 (61.8) 102 (59.6) 0.818
Done 13 (38.2) 69 (40.4)

HER2=human epidermal growth factor receptor 2; IHC=immunohistochemistry; BCS=breast conserving surgery; SLNB=sentinel lymph node biopsy; ALND=axillary lymph node dissection.

(B) Each stage
Characteristic HER2 -positive breast cancer by IHC
Stage HER2 2+/low HER2 3+/high p-value
No. (%) No. (%)
Breast operation type BCS I 3 (75.0) 51 (75.0) 1.000
II 18 (78.3) 35 (51.5) 0.025
III 2 (28.6) 12 (34.3) 0.772
Mastectomy I 1 (25.0) 17 (25.0) 1.000
II 5 (21.7) 33 (48.5) 0.025
III 5 (71.4) 23 (65.7) 0.772
Axilla operation type SLNB I 2 (50.0) 25 (36.8) 0.597
II 8 (34.8) 27 (39.7) 0.617
III 0 0 0.001
ALND I 2 (50.0) 25 (36.8) 0.597
II 15 (65.2) 39 (57.4) 0.617
III 7 (100.0) 35 (100.0) 0.001
Chemotherapy Done I 4 (100.0) 49 (72.1) 0.221
II 18 (78.3) 57 (83.8) 0.546
III 7 (100.0) 34 (97.1) 0.654
Radiotherapy Done I 3 (75.0) 44 (64.7) 1.000
II 15 (65.2) 38 (56.7) 0.477
III 4 (57.1) 21 (60.0) 0.889
Endocrine therapy Done I 4 (100) 55 (80.9) 0.337
II 21 (91.3) 49 (72.1) 0.059
III 2 (28.6) 23 (65.7) 0.071
HER2-targeted therapy Done I 0 20 (29.4) 0.205
II 9 (39.1) 34 (50.0) 0.369
III 4 (57.1) 15 (42.9) 0.493

HER2=human epidermal growth factor receptor 2; IHC=immunohistochemistry; BCS=breast conserving surgery; SLNB=sentinel lymph node biopsy; ALND=axillary lymph node dissection.

Table 2.
Pathologic characteristics of HER2-positive breast cancer according to low and high level of HER2 receptor expression by IHC
(A) All stages combined
Characteristic HER2 -positive breast cancer by IHC
HER2 2+/low (n=34) HER2 3+/high (n=171) p-value
No. (%) No. (%)
HG I 2 (5.9) 4 (2.3) 0.195
II 10 (29.4) 29 (17.0)
III 20 (58.8) 120 (70.2)
N/A 2 (5.9) 18 (10.5)
ER Allred score 0-6 10 (29.4) 116 (67.8) < 0.001
7-8 24 (70.6) 55 (32.2)
PR Allred score 0-6 19 (55.9) 135 (78.9) < 0.001
7-8 15 (44.1) 36 (21.1)
LI No 8 (23.5) 81 (47.4) 0.010
Yes 26 (76.5) 90 (52.6)
VI No 29 (85.3) 138 (80.7) 0.530
Yes 5 (14.7) 33 (19.3)
NI No 30 (88.2) 165 (96.5) 0.041
Yes 4 (11.8) 6 (3.5)
Ki 67 ≤ 20% 21 (61.8) 55 (32.2) 0.001
> 20% 13 (38.2) 116 (67.8)
Bcl-2 ≤ 30% 10 (29.4) 115 (67.3) < 0.001
> 30% 24 (70.6) 55 (32.2)
N/A 0 1 (0.6)

HER2=human epidermal growth factor receptor 2; IHC=immunohistochemistry; HG=histologic grade; N/A=not available; ER=estrogen receptor; PR=progesterone receptor; LI=lymphatic invasion; VI=vascular invasion; NI=neural invasion.

(B) Each stage
Characteristic HER2 -positive breast cancer by IHC
Stage HER2 2+/low HER2 3+/high p-value
No. (%) No. (%)
ER Allred score 7-8 I 2 (50.0) 21 (30.9) 0.428
II 19 (82.6) 24 (35.3) < 0.001
III 3 (42.8) 10 (28.5) < 0.001
PR Allred score 7-8 I 1 (25.0) 17 (25.0) 1.000
II 13 (56.5) 15 (22.1) 0.002
III 1 (14.3) 4 (11.4) < 0.001
LI Yes I 0 12 (17.6) 0.360
II 19 (82.6) 43 (63.2) 0.086
III 7 (100.0) 35 (100.0) < 0.001
VI Yes I 0 3 (4.4) 0.670
II 3 (13.0) 13 (19.1) 0.510
III 2 (28.6) 17 (48.6) 0.337
NI Yes I 0 0 1.000
II 3 (13.0) 3 (4.4) 0.151
III 1 (14.3) 3 (8.6) 0.642
Ki 67 > 20% I 1 (25.0) 40 (58.8) 0.187
II 8 (34.8) 48 (70.6) 0.002
III 4 (57.1) 28 (80.0) 0.200
Bcl-2 > 30% I 2 (50.0) 21 (30.9) 0.428
II 16 (69.6) 28 (41.2) 0.058
III 6 (85.7) 6 (17.1) < 0.001

HER2=human epidermal growth factor receptor 2; IHC=immunohistochemistry; ER=estrogen receptor; PR=progesterone receptor; LI=lymphatic invasion; VI=vascular invasion; NI=neural invasion.

Table 3.
Organ specific recurrences of HER2-positive breast cancer according to low and high level of HER2 receptor expression by IHC
(A) All stages combined
Characteristic HER2 -positive breast cancer by IHC
HER2 2+/low (n=34) HER2 3+/high (n=171) p-value
No. (%) No. (%)
Breast No 28 (82.4) 155 (90.6) 0.154
Yes 6 (17.6) 16 (9.4)
Bone No 29 (85.3) 150 (87.7) 0.698
Yes 5 (14.7) 21 (12.3)
Lung No 29 (85.3) 159 (93.0) 0.138
Yes 5 (14.7) 12 (7.0)
Liver No 33 (97.1) 160 (93.6) 0.429
Yes 1 (2.9) 11 (6.4)
Brain No 31 (91.2) 164 (95.9) 0.243
Yes 3 (8.8) 7 (4.1)
LN No 25 (73.5) 155 (90.6) 0.005
Yes 9 (26.5) 16 (9.4)

HER2=human epidermal growth factor receptor 2; IHC=immunohistochemistry; LN=lymph node.

(B) Each stage
Characteristic HER2 -positive breast cancer by IHC
Stage HER2 2+/low HER2 3+/high p-value
No. (%) No. (%)
Breast Yes I 2 (50.0) 8 (11.8) 0.032
II 3 (13.0) 4 (5.9) 0.267
III 1 (14.3) 4 (11.4) 0.833
Bone Yes I 0 3 (4.4) 0.670
II 3 (13.0) 7 (10.3) 0.717
III 2 (28.6) 11 (31.4) 0.882
Lung Yes I 0 3 (4.4) 0.670
II 4 (17.4) 3 (4.4) 0.044
III 1 (14.3) 6 (17.1) 0.854
Liver Yes I 0 2 (2.9) 0.729
II 0 6 (8.8) 0.142
III 1 (14.3) 3 (8.6) 0.642
Brain Yes I 0 1 (1.5) 0.808
II 2 (8.7) 1 (1.5) 0.095
III 1 (14.3) 5 (14.3) 1.000
LN Yes I 0 3 (4.4) 0.670
II 6 (26.1) 7 (10.3) 0.062
III 3 (42.9) 6 (17.1) 0.134

HER2=human epidermal growth factor receptor 2; IHC=immunohistochemistry; LN=lymph node.

REFERENCES

1. Hudis CA. Trastuzumab—mechanism of action and use in clinical practice. N Engl J Med 2007;357:30-5.

2. Meric-Bernstam F, Hung MC. Advances in targeting human epidermal growth factor receptor-2 signaling for cancer therapy. Clin Cancer Res 2006;12:6326-30.
crossref pmid
3. Slamon DJ, Clark GM, Wong SG. Human breast cancer: correlation of relapse and survival with amplification of the HER-2/neu oncogene. Science 1987;235:177-82.
crossref pmid
4. Slamon DJ, Godolphin W, Jones LA, Holt JA, Wong SG, Keith DE, et al. Studies of the HER-2/neu proto-oncogene in human breast and ovarian cancer. Science 1989;244:707-12.
crossref pmid
5. Gabos Z, Sinha R, Hanson J, Chauhan N, Hugh J, Mackey JR, et al. Prognostic significance of human epidermal growth factor receptor positivity for the development of brain metastasis after newly diagnosed breast cancer. J Clin Oncol 2006;24:5658-63.
crossref pmid
6. Pernas S, Tolaney SM. HER2-positive breast cancer: new therapeutic frontiers and overcoming resistance. Ther Adv Med Oncol 2019;11:1-1.
crossref
7. Ihemelandu CU, Naab TJ, Mezghebe HM, Makambi KH, Siram SM, Leffall LD, et al. Treatment and survival outcome for molecular breast cancer subtypes in black women. Ann Surg 2008;247:463-9.
crossref
8. Houssami N, Macaskill P, Minckwitz GV, Marinovich ML, Mamounas E. Meta-analysis of the association of breast cancer subtype and pathologic complete response to neoadjuvant chemotherapy. Eur J Cancer 2012;48:3342-54.
crossref pmid
9. Wang H, Zhang C, Zhang J, Kong L, Zhu H, Yu J. The prognosis analysis of different metastasis pattern in patients with different breast cancer subtypes: a SEER based study. Oncotarget 2017;8:26368-7.
crossref pmid
10. Hanna WM, Slodkowska E, Lu FI, Nafisi H, Nofech-Mozes S. Comparative analysis of human epidermal growth factor receptor 2 testing in breast cancer according to 2007 and 2013 American society of clinical oncology/college of American pathologists guideline recommendations. J Clin Oncol 2017;35:3039-45.
crossref
11. Wolff AC, Hammond EH, Hicks DG, Dowsett M, McShane LM, Allison KH, et al. Recommendations for human epidermal growth factor receptor 2 testing in breast cancer: American society of clinical oncology/college of American pathologists clinical practice guideline update. J Clin Oncol 2013;31:3997.
crossref pmid
12. Liu ZH, Wang K, Lin DY, Xu J, Chen J, Long XY, et al. Impact of the updated 2018 ASCO/CAP guidelines on HER2 FISH testing in invasive breast cancer: a retrospective study of HER2 FISH results of 2233 cases. Breast Cancer Res Treat 2019;175:51-7.
crossref pmid
13. Marchiò C, Annaratone L, Marques A, Casorzo L, Berrino E, Sapino A. Evolving concepts in HER2 evaluation in breast cancer: heterogeneity, HER2-low carcinomas and beyond. Semin Cancer Biol 2021;72:123-35.
crossref pmid
14. Nuciforo P, Thyparambil S, Aura C, Garrido-Castro A, Vilaro M, Peg V, et al. High HER2 protein levels correlate with increased survival in breast cancer patients treated with anti-HER2 therapy. Mol Oncol 2016;10:138-47.
crossref pmid
15. Kim HS, Park I, Cho HJ, Gwak GH, Yang KH, Bae BN, et al. Analysis of the potent prognostic factors in luminal-type breast cancer. J Breast Cancer 2012;15:401-6.
crossref pmid pmc
16. Park K, Han S, Kim JY, Kim HJ, Kwon JE, Gwak GH. Silver-enhanced in situ hybridization as an alternative to fluorescence in situ hybridization for assaying HER2 amplification in clinical breast cancer. J Breast Cancer 2011;14:276-82.
crossref
17. Buckley NE, Forde C, McArt DG, Boyle DP, Mullan PB, James JA, et al. Quantification of HER2 heterogeneity in breast cancer-implications for identification of sub-dominant clones for personalized treatment. Sci Rep 2016;6:23383.
pmid pmc
18. Lee HJ, Kim JY, Park SY, Park IA, Song IH, Yu JH, et al. Clinicopathologic significance of the intratumoral heterogeneity of HER2 gene amplification in HER2-positive breast cancer patients treated with adjuvant trastuzumab. Am J Clin Pathol 2015;14:570-8.
crossref
19. Allison KH, Dintzis SM, Schmidt RA. Frequency of HER2 heterogeneity by fluorescence in situ hybridization according to CAP expert panel recommendations: time for a new look at how to report heterogeneity. Am J Clin Pathol 2011;136:864-71.
pmid
20. Vance GH, Barry TS, Bloom KJ, Fitzgibbons PL, Hicks DG, Jenkins RB, et al. Genetic heterogeneity in HER2 testing in breast cancer: panel summary and guidelines. Arch Pathol Lab Med 2009;133:611-2.
crossref pmid
21. Beca F, Polyak K. Intratumor heterogeneity in breast cancer. Adv Exp Med Biol 2016;882:169-89.
crossref pmid
22. Arpino G, Wiechmann L, Osborne C, Schiif R. Crosstalk between the estrogen receptor and the HER tyrosine kinase receptor family: molecular mechanism and clinical implications for endocrine therapy resistance. Endocr Rev 2008;29:217-33.
crossref pmid pmc
23. Garcia-Becerra R, Santos N, Diaz L, Camacho J. Mechanisms of resistance to endocrine therapy in breast cancer: focus on signaling pathways, miRNAs and genetically based resistance. Int J Mol Sci 2013;14:108-145.
crossref
24. Rexer BN, Arteaga CL. Intrinsic and acquired resistance to HER2-targeted therapies in HER2 gene-amplified breast cancer: mechanisms and clinical implications. Crit Rev Oncog 2012;17:1-16.
crossref pmid pmc
25. Shou J, Massarweh S, Osborne CK, Wakeling AE, Ali S, Weiss H, et al. Mechanisms of tamoxifen resistance: increased estrogen receptor-HER2/neu cross-talk in ER/HER2-positive breast cancer. J Natl Cancer Inst 2004;96:926-35.
crossref pmid
26. Lousberg L, Collignon J, Jerusalem G. Resistance to therapy in estrogen receptor positive and human epidermal growth factor 2 positive breast cancers: progress with latest therapeutic strategies. Ther Adv Med Oncol 2016;8:429-49.
crossref pmid pmc
27. Goldhirsch A, Winer EP, Coates AS, Gelber RD, Piccart-Gebhart M, Thürlimann B, et al. Personalizing the treatment of women with early breast cancer: highlights of the St Gallen international expert consensus on the primary therapy of early breast cancer 2013. Ann Oncol 2013;24:2206-23.
pmid pmc
28. Kurbel S, Dmitrović B, Marjanović K, Vrbanec D, Juretić A. Distribution of Ki-67 values within HER2 & ER/PgR expression variants of ductal breast cancers as a potential link between IHC features and breast cancer biology. BMC Cancer 2017;17:231.
pmid pmc
Editorial Office
519-763, 전라남도 화순군 화순읍 서양로 322
TEL : 061-379-7646    FAX : 061-379-7661    E-mail : jbd.editorial@gmail.com

Copyright© Korean Breast Cancer Society.                Developed in M2PI
About |  Browse Articles |  Current Issue |  For Authors and Reviewers